UNEMPLOYMENT, CYCLE AND GENDER
AMADO PEIRÓ JORGE BELAIRE-FRANCH MARIA TERESA GONZALO
FUNDACIÓN DE LAS CAJAS DE AHORROS DOCUMENTO DE TRABAJO
Nº 581/2011
De conformidad con la base quinta de la convocatoria del Programa de Estímulo a la Investigación, este trabajo ha sido sometido a eva- luación externa anónima de especialistas cualificados a fin de con- trastar su nivel técnico.
ISSN: 1988-8767
La serie DOCUMENTOS DE TRABAJO incluye avances y resultados de investigaciones dentro de los pro- gramas de la Fundación de las Cajas de Ahorros.
Las opiniones son responsabilidad de los autores.
UNEMPLOYMENT, CYCLE AND GENDER
Amado Peiró*
Jorge Belaire-Franch*
Maria Teresa Gonzalo*
Abstract
This study analyzes the relationship between unemployment and the business cycle in the UK and the US. For both economies, a strong and definite association is found that shows that cyclical shocks extend their effect on unemployment over several quarters. This association is much more intense for male unemployment than for female unemployment, and has lost some strength in the UK in the last few years. Markov switching regime models with two regimes display clear differences between expansions and contractions in both countries.
Key words: Business cycle, gender, Markov switching regime model,
unemployment
JEL classification: E32, J64
Corresponding author:Amado Peiró Giménez. E-mail: [email protected]
*Departament of Economic Analysis, University of Valencia
Acknowledgement:The authors are grateful to an anonymous referee and participants at the XXV AIEL Conference of Labour Economics, Chieti-Pescara (Italy), and the 6th Eurostat Colloquium on Modern Tools for Business Cycle Analysis, Luxembourg, for their useful comments and suggestions. Financial support from the Ministerio de Educación y Ciencia (SEJ2007-67101/ECON) is gratefully acknowledged.
1. Introduction
The cyclical nature of economic dynamics is commonly accepted. Periods of high economic activity, or expansions, are followed by periods of low economic activity, or contractions, in a non-regular sequence. Although the duration of all these periods may be very different, they are recurrent and display certain comovements among important economic variables. Numerous researchers have studied these business cycles for many decades. Burns and Mitchell (1946) was a milestone in the research on this issue with its contribution to the definition and measurement of business cycles, and since then the dating of phases and the extraction of cyclical components of economic variables has attracted the attention of many researchers.
Output and unemployment are two key variables of the business cycle, such that they are taken into account in virtually all the research on cycles and are of maximum importance in macroeconomic performance. Their role in business cycles is clear, but their movements have opposite signs. Output is clearly a procyclical variable, undoubtedly the most defining variable of business cycles phases, and its movements give rise to the different expansions and contractions in many chronologies. On the other hand, unemployment is a clearly countercyclical variable and, consequently, increases in contractions and decreases in expansions. These opposite directions across business cycles should give rise to an inverse relationship between output and unemployment.
However, several issues may hide this relationship. Firstly, there may be flows
from unemployment to out of the labor force and vice versa that could distort or
cause difficulties in studying the link between these two variables. These flows
may be induced by phenomena such as ‘the added worker effect’ or ‘the
discouraged unemployed.’ Secondly, the relationship between output and
unemployment may be dynamic instead of fully contemporaneous. In addition to
a simultaneous effect, the response of unemployment to cyclical shocks may
take some time and, therefore, unemployment could be a lagging indicator of
business cycles. In fact, according to NBER business cycle dating for the US,
unemployment peaked more than one year after the trough in the last two
contractions (15 and 19 months after, respectively.) To complicate things even
further, besides this dynamic relationship, the labor market could also anticipate
future cyclical movements. Finally, changes in aspects such as employment protection legislation and dismissal costs may affect the relationship or its dynamics (see, for example, Alewell, Schott, and Wiegand, 2009 or Wolfers,
2005.) This possible distribution of the e
ffects of business cycles on
unemployment may imply that the effect is relatively weak in each single time period, but spreads over time; unemployment may react to cyclical shocks or policy measures a long time after they took place. Consequently, from a policy perspective, it is important to elucidate the time distribution of unemployment variations triggered by business cycles.
The relationship between unemployment and business cycles may have changed in the last few decades. In fact, many researchers believe that recent business cycles are rather different from the preceding ones. Variability in main economic aggregates has decreased, and contractions have been less frequent and severe (since November 1982 the NBER has dated only two contractions in the US lasting eight months each.) Factors such as the increase in the service sector with respect to industry or agriculture, or a major role of the public sector in modern economies, could be behind these changes, and this weakening of cyclical movements may have altered their linkage with unemployment.
Nevertheless, the interest in the relationship between output and unemployment
over the business cycle has recently increased in the light of current economic
events. The pronounced downturn in economic activity that began in 2008 in
many countries has sparked a sharp increase in unemployment. This situation
has generated huge interest in this topic, especially in those countries which
face high unemployment rates unheard of in many years.
The consequences of cyclical movements on unemployment may also di
ffer
by gender. While a great deal of literature exists on gender differences in labor participation and wages, research on gender differences in unemployment and their relationship with the business cycle is much more sparse. Traditionally, it has been widely accepted that the labor supply curve is more elastic among women (Killingsworth, 1983, Blundell and MaCurdy, 1999), and this fact could be the basis of existing differences in unemployment across the business cycle.
Nevertheless, several researchers have examined these issues from different perspectives and have come to different conclusions. Clark and Summers (1981) found that the cyclical behavior of employment is not age and gender neutral, as employment of young women was more responsive to cyclical shifts than employment of older women, and the latter was, in his turn, more responsive than employment of similarly aged men. Blank (1989) found a stronger association of changes in employment with changes in GDP for women than for men of the same race. Solon, Barsky and Parker (1994) and Kandil and Woods (2003), however, report empirical evidence that questions the higher elasticity of labor supply among women, though their results do not
exclude the possibility of di
fferent cyclical behavior in the extensive margins for
men and women. Queneau and Sen (2008) consider several theories regarding the dynamics of unemployment over the business cycle, and present evidence of gender differences in unemployment dynamics in three out of eight OECD countries, but the degree of persistence in male and female unemployment rates is relatively low in all the countries under examination.
When considering the relationship of business cycles with unemployment,
another important aspect is the possible existence of asymmetries. The pre-
sumption that important economic variables present asymmetric behavior over the business cycles has a long tradition in economic thought, which dates back to the pioneering work on business cycles by Mitchell (1927.) In fact, many researchers, including Keynes (1936), have firmly believed that business cycles display marked asymmetries. Much later, in a seminal study, Neftçi (1984) formally tested the asymmetric behavior of unemployment over the business cycle and since then a large number of studies have followed. DeLong and Summers (1986), Hussey (1992), Acemoglu and Scott (1994), Koop and Potter (1999), McKay and Reis (2008), among many others, have also found asymmetries in labor market variables. Though these conclusions are not unanimous, one may conclude with Mittnik and Niu (1994) that ‘Although the empirical evidence on business cycle asymmetries is somewhat mixed, there appears to be fairly strong support for asymmetries in unemployment data, while there is somewhat weaker support for aggregate output data.’ In fact, McKay and Reis (2008) recently proposed a new business cycle feature:
‘contractions in employment are briefer and more violent than expansions but we cannot reject the null of equal brevity and violence for expansions and contractions in output.’
If unemployment displays an asymmetric evolution over time but output does not display clear asymmetries, the source of unemployment asymmetries could lie in the nature of its dependence on output. Several researchers have investigated asymmetries and non-linearities in the relationship between unemployment and cyclical movements from the perspective of Okun’s law.
Virén (2001) presents evidence of non-linearities in Okun’s relationship for 18
out of 20 OECD countries. Huang and Chang (2005)
find support of thresholdnon-linearity for Canada. Using Hamilton’s
flexible nonlinear inference, Huangand Lin (2006)
find clear evidence of nonlinearity between the cyclicalcomponents of US unemployment and output. Silvapulle, Moosa and Silvapulle
(2004) present evidence of asymmetry in the output-unemployment relationship
for the US post-war economy so that the response of unemployment is stronger
to negative than to positive cyclical output. Holmes and Silverstone (2006) use
the Markov regime-switching model to analyze asymmetries in Okun’s law for
the US. When testing linearity against nonlinearity in US data, Crespo (2003)
concludes the existence of a regime dependent Okun’s parameter, which implies that cyclical unemployment is more responsive to changes in negative cyclical output.
The aim of this paper is to examine the association between unemployment
and business cycles in two main economies, the United Kingdom and the
United States. Special attention will be paid to essential aspects of this
relationship, such as differences by gender, changes over time and possible
asymmetries. A clear dynamic association is found between cycle and
unemployment, but this relationship differs by gender and presents
asymmetries. In order to achieve these objectives, Section 2 presents the data
used in this study. Section 3 analyzes these relationships from a general
perspective, by gender and by period of time. Section 4 examines the empirical
evidence looking for possible asymmetries between expansions and
contractions. Finally, Section 5 summarizes the main conclusions.
2. Data
Quarterly data on GDP for the UK and the US were collected from
International Financial Statistics, International Monetary Fund, and from the Bureau of Economic Analysis, US Department of Commerce, respectively. They cover theperiod 1971:1–2008:4 and 1948:1–2008:4, respectively, and are seasonally adjusted. With regard to labor markets, quarterly data on unemployment rates were obtained for the UK from the
UK Office for National Statisticsand for the US from the
Bureau of Labor Statistics, US Department of Labor. They coverthe same periods as GDP and are also seasonally adjusted.
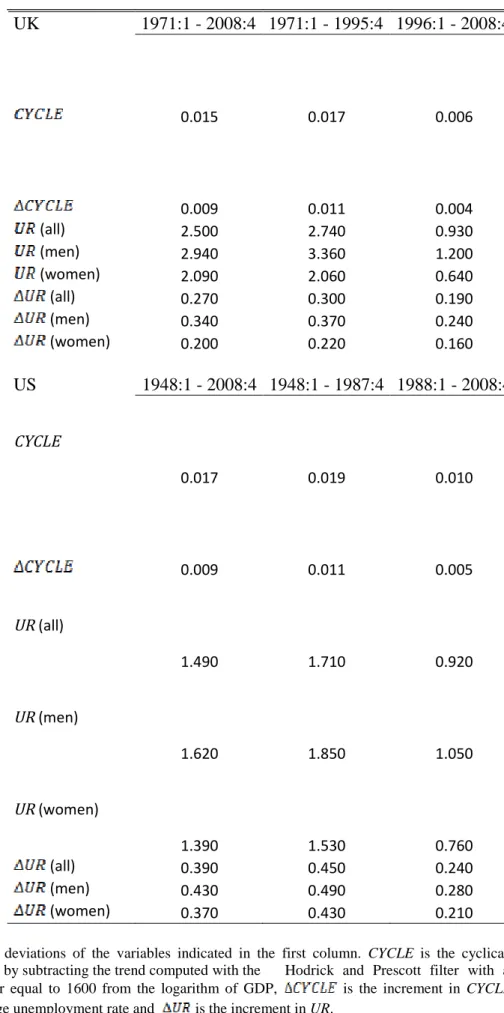
For both countries, GDP presents a clear trend. To obtain the cyclical component, these series must be detrended. The detrending procedure is highly controversial, as different methods give rise to different properties of the resulting cyclical component. Probably, the filter proposed by Hodrick and Prescott (1980 and 1997), HP, is the most widely used. This filter has been applied to the logarithm of GDP with a smoothing parameter equal to 1600, the value proposed by Hodrick and Prescott (1997) for quarterly data. The difference between the original series (GDP in logs) and the trend obtained is the cyclical component, which is shown in Figure 1, panels A and B.
Perhaps the most striking feature of these two graphs is the lower variability
or volatility that cyclical GDP displays in both countries in the last few years of
the sample (though the last quarter registers a hard fall.) Table 1 shows the
standard deviations of cyclical GDP in different periods: the whole sample, the
first two thirds of the sample and the last third of the sample. The standard
deviation of cyclical GDP is clearly lower in the last few years. It is about one
third in the UK and about one half in the US. The same happens with the
increments in cyclical GDP (see Figure 1, panels C and D, and Table 1.) This
much smoother evolution is a well known fact that has been discussed in detail
and could be due to several factors such as better statistics, the growing share
of services in GDP or the role of the public sector and has led many
researchers to enquire about the drastic change in recent business cycles or
even their end.
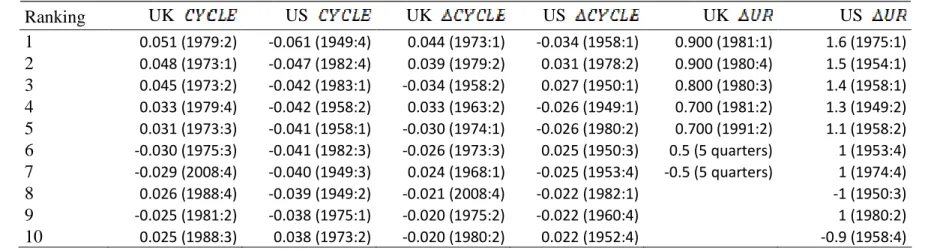
1It is also interesting to note in Figure 1, panels A and B, that most extreme values of the cyclical component are positive in the UK and negative in the US. This asymmetry is also shown in Table 2. Although the mean of the cyclical components is zero, the
five most extreme cyclicalcomponents are positive in the UK, while the nine most extreme are negative in the US. However, this feature disappears almost completely in both countries when examining the series of increments in cyclical components (see Table 2 and panels C and D in Figure 1.)
-.06 -.04 -.02 .00 .02 .04 .06
1950 1960 1970 1980 1990 2000 Panel A. UK cycle
-.06 -.04 -.02 .00 .02 .04 .06
1950 1960 1970 1980 1990 2000 Panel B. USA cycle
-.06 -.04 -.02 .00 .02 .04 .06
1950 1960 1970 1980 1990 2000 Panel C. UK cycle increments
-.06 -.04 -.02 .00 .02 .04 .06
1950 1960 1970 1980 1990 2000 Panel D. USA cycle increments
Figure 1: Panels A and B show UK and US cyclical components obtained by subtracting the trend computed with the Hodrick and Prescott filter with a smoothing parameter equal to 1600 from the logarithm of GDP, and panels C and D show their increments.
1However, the last quarter in the sample, as well as the first quarters in 2009, show a sharp decline in GDP in both countries. These movements would question some of these claims.
Table 1: Standard deviations
_________________________________________________________
UK 1971:1 - 2008:4 1971:1 - 1995:4 1996:1 - 2008:4
0.015 0.017 0.006
0.009 0.011 0.004
(all) 2.500 2.740 0.930
(men) 2.940 3.360 1.200
(women) 2.090 2.060 0.640
(all) 0.270 0.300 0.190
(men) 0.340 0.370 0.240
(women) 0.200 0.220 0.160
US 1948:1 - 2008:4 1948:1 - 1987:4 1988:1 - 2008:4
CYCLE
0.017 0.019 0.010
0.009 0.011 0.005
UR(all)
1.490 1.710 0.920
UR(men)
1.620 1.850 1.050
UR(women)
1.390 1.530 0.760
(all) 0.390 0.450 0.240
(men) 0.430 0.490 0.280
(women) 0.370 0.430 0.210
Standard deviations of the variables indicated in the first column. CYCLE is the cyclical component obtained by subtracting the trend computed with the Hodrick and Prescott filter with a smoothing parameter equal to 1600 from the logarithm of GDP, is the increment in CYCLE,UR is the percentage unemployment rate and is the increment inUR.
With regard to unemployment, the first important feature to analyze is
whether the reduction in the amplitude of cyclical movements in GDP in the last
few decades could have been propagated to unemployment. In order to analyze
this possibility, Figure 2, panels A and B, shows the unemployment rates in the
UK and USA. There also seems to be lower variability in the last few years, but
this is not very clear. When taking increments in unemployment rates (see
panels C and D in Figure 2), a similar pattern to that of cyclical GDP is observed
more clearly: variability also decreases greatly in the last few years. This is
confirmed in Table 1, where both unemployment rates and their changes record
a lower standard deviation in the last sub-samples.
Table 2: Most extreme values
___________________________________________________________________________________________________
Ranking UK US UK US UK US
1
0.051 (1979:2) -0.061 (1949:4) 0.044 (1973:1) -0.034 (1958:1) 0.900 (1981:1) 1.6 (1975:1)2
0.048 (1973:1) -0.047 (1982:4) 0.039 (1979:2) 0.031 (1978:2) 0.900 (1980:4) 1.5 (1954:1)3
0.045 (1973:2) -0.042 (1983:1) -0.034 (1958:2) 0.027 (1950:1) 0.800 (1980:3) 1.4 (1958:1)4
0.033 (1979:4) -0.042 (1958:2) 0.033 (1963:2) -0.026 (1949:1) 0.700 (1981:2) 1.3 (1949:2)5
0.031 (1973:3) -0.041 (1958:1) -0.030 (1974:1) -0.026 (1980:2) 0.700 (1991:2) 1.1 (1958:2)6
-0.030 (1975:3) -0.041 (1982:3) -0.026 (1973:3) 0.025 (1950:3) 0.5 (5 quarters) 1 (1953:4)7
-0.029 (2008:4) -0.040 (1949:3) 0.024 (1968:1) -0.025 (1953:4) -0.5 (5 quarters) 1 (1974:4)8
0.026 (1988:4) -0.039 (1949:2) -0.021 (2008:4) -0.022 (1982:1) -1 (1950:3)9
-0.025 (1981:2) -0.038 (1975:1) -0.020 (1975:2) -0.022 (1960:4) 1 (1980:2)10
0.025 (1988:3) 0.038 (1973:2) -0.020 (1980:2) 0.022 (1952:4) -0.9 (1958:4)The entries are the most extreme cyclical components, increments in cyclical components and increments in unemployment rates with their dates in parentheses.
2 4 6 8 10 12
1950 1960 1970 1980 1990 2000 Panel A. UK unemployment rate
2 4 6 8 10 12
1950 1960 1970 1980 1990 2000 Panel B. USA unemployment rate
-1.6 -1.2 -0.8 -0.4 0.0 0.4 0.8 1.2 1.6
1950 1960 1970 1980 1990 2000 Panel C. UK increments in unemployment rate
-1.6 -1.2 -0.8 -0.4 0.0 0.4 0.8 1.2 1.6
1950 1960 1970 1980 1990 2000 Panel D. USA increments in unemployment rate
Figure 2: Panels A and B show UK and US percent unemployment rates, and panels C and D their increments.
Another interesting point reflected in Table 1 is that unemployment variables for women record a lower standard deviation than for men. For both countries, for the whole sample and for each sub-sample, women series vary less than their male counterparts and differences are often substantial. This could be at least partially due to female employment being more stable than male employment which would in turn be a possible consequence of the differences in gender employment by economic sector or activity. If sectors that are more sensitive to cyclical shocks have a large proportion of male employment, cyclical fluctuations will exert a stronger effect on male unemployment, and the relationship of cyclical movements with unemployment will be more intense for men than for women.
Finally, there seem to be some asymmetries in unemployment rates. Let us
take US unemployment first. It is remarkable to note that in Figure 2, panel B,
the unemployment rate in the US displays sharp peaks and much more rounded troughs: unemployment increases rapidly, but decreases more gradually. This point can be confirmed by looking at the increments in the unemployment rates in panel D. It is evident that the most extreme values are positive; in fact, eight out of the nine most extreme values are positive (see Table 2.) This can also be observed in the histogram of the empirical distribution of changes in unemployment rates (not shown here for reasons of space), skewed to the right with a skewness statistic equal to 1.04. This phenomenon may be not so evident for the UK in panel A, but it is also somewhat noticeable in the series of increments in the UK unemployment rate (see Figure 2, panel C); as shown in Table 2, the five most extreme variations in the UK unemployment rate are also positive. The empirical distribution is also skewed to the right with a skewness statistic of 0.73. Consequently, it seems reasonable to suspect the existence of asymmetries in unemployment rates and in their increments, both in the UK and the US.
3. Unemployment and business cycle
In order to analyze the relationship between unemployment and business cycle, different regression models could be specified. One of the first natural choices would be:
(1) i.e., the (quarterly) unemployment rate ( ) is regressed against the (quarterly) cyclical component of GDP ( ). This first approach to the problem, however, does not take into account a long standing issue regarding empirical macroeconomics: the integration order of the involved variables. On the one hand, the cyclical component is, by construction, a stationary ( variable.
2On the other hand, the unemployment rate requires further investigation since we
2 In fact, the cyclical component obtained with the standard Hodrick-Prescott filter is always an
variable.
do not have beliefs a priori about its degree of persistence. Tables 3–4 present some unit root and stationarity tests for .
3Table 3: Unit Root Tests (Unemployment Rate)
DF-GLS Ng-Perron Breitung
UK
-1.246 -6.801* -1.829* 0.269 3.653* 0.019US
-0.997 -11.871** -2.350** 0.198** 2.403** 0.014*The entries are the Dickey-Fuller GLS detrended (DF-GLS), Ng-Perron and Breitung test statistics. In the case of the DF-GLS and Ng-Perron statistics, the optimal lags were automatically selected by using the Modified Akaike Information Criterion. The frequency zero spectrum was estimated by the AR-GLS detrended data method. The superscripts *, ** and *** indicate significance at the 10%, 5% and 1%
levels, respectively.
Table 4: Stationarity Tests (Unemployment Rate)
KPSS Bierens-Guo
Bartlett kernel
QS kernel
UK
0.386* 2.625*** 183.87*** 158.76*** 3.42 1.65US
0.181 0.158 3.107 3.267 0.787 0.667The entries are the Kwiatkovski et al. (KPSS) (1992) and Bierens-Guo (BG) (1993) test statistics. The optimal truncation lag for the KPSS was automatically selected by using Andrews’ (1991) procedure. The superscripts *, ** and *** indicate significance at the 10%, 5% and 1% levels, respectively.
Regarding the UK unemployment rate, there is weak evidence against the unit root hypothesis and strong evidence against stationarity. There is however stronger evidence against the unit root null for the US unemployment rate and we have not found evidence against the stationarity hypothesis. Hence, we would conclude that the US unemployment rate is an variable, whereas we have conflicting results for the UK unemployment rate. Thus, if we run the regression (1), we cannot preclude the possibility that, in the case of the UK, we could have an variable regressed against an variable, i.e., in Granger’s(1995) terminology, we could have an unbalanced equation, in the sense that there could be an unwanted strong property on the left hand side of (1).
3 We have computed the GLS-detrended augmented Dickey-Fuller (DF-GLS, 1996), the Ng-Perron (2001) and Breitung (2002) unit root tests and the Kwiaikovski et al. (1992) and Bierens-Guo (1993) stationarity tests.
In addition, abstracting from the aforementioned possibility of facing an unbalanced equation for the UK, the regression of (1) yields anomalous results.
Simple regressions of the unemployment rate on a constant and current cyclical component or on a constant and single lag or lead show significant negative slopes, for both the UK and the US. Nevertheless, for both countries, multiple regression of the unemployment rate on a constant and current cyclical component, together with several leads and lags, shows high joint significance, but none of the individual coefficients are significant. Similar results are obtained when taking the increments in the unemployment rate. This phenomenon is due to the high collinearity existent among cyclical components in successive quarters and it is a direct consequence of the detrending procedure. Although the cyclical component is stationary, it displays a high autocorrelation, with first-order correlations of 0.76 and 0.83 for the UK and the US, respectively.
Among many other problems, this collinearity prevents studying the dynamics of the response of unemployment to cyclical conditions. In order to circumvent or mitigate these difficulties, first differences in the cyclical component were obtained. These differences register a much lower collinearity, with first-order correlations now equal to -0.12 and 0.27 for the UK and the US, respectively.
Hence, variations in unemployment rates were regressed on a constant and changes in the cyclical component,
(2) where is the variation in the unemployment rate in quarter
t,is the increment in the cyclical component in quarter
tand is the error term for the same quarter. Notice that with (2) we also solve the unbalanced equation problem we could face if the UK unemployment rate were a truly variable, since differencing both sides of (1) renders stationary variables in any case.
Values for
mand
n(lag and lead selection) were chosen by using sequential
Ftests with a significance level set at 5%, and the conclusions were almost identical to those obtained using Schwarz’s Bayesian Information Criterion.
Table 5 shows the results obtained for the UK and the US.
Table 5: Regression results
UK US
0.017
(0.029) 0.0064
(0.0153)
-4.09**
(2.00) -7.37***
(1.72)
-9.92***
(2.30)
-21.84***
(1.75)
-10.58***
(2.74) -14.19***
(2.21)
-9.75***
(2.56) -8.78***
(1.39)
-8.90***
(2.22)
-4.70***
(1.58)
-6.62***
(1.85) -
-4.43**
(1.75) -
45% 70%
Results of the regressions for both the UK and the US, where
is the change in the unemployment rate in quartert and is the change in the cyclical component in quartert.mis equal to 5 and 3, respectively, for the UK and the US, and n is 1 for both countries. Values in parentheses are Newey-West robust standard errors. The superscripts *, ** and ***
indicate significance at the 10%, 5% and 1% levels, respectively.
This table presents several important results: i) Excluding the constants, the regressors included are, as expected, always negative, thus indicating a negative relationship between variations in business cycle and changes in unemployment rates; ii) Excluding the intercepts, the regressors are always clearly significant; iii) Variations in unemployment rates depend not only on contemporaneous changes in cyclical conditions but also on cyclical changes that took place several quarters before (five quarters in the UK and three in the US) and, interestingly, on cyclical changes that will take place in the following quarter. Therefore, the labor market reacts immediately and with a delay of several quarters to cyclical shocks, but also anticipates imminent cyclical changes; iv) As expected, the values of the estimates corresponding to nearer lags are higher (in absolute values) than those corresponding to further lags.
This indicates the labor market is more sensitive to the most recent cyclical
conditions; v) As reflected by the coefficients of determination, dependence
seems to be stronger in the US than in the UK, but endures longer in the UK
than in the US.
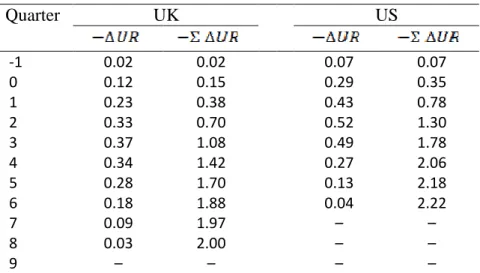
It is also important to grasp the meaning of the estimates. In order to do so, let us simulate the effects of a hypothetical expansion on unemployment. Let us suppose that in a ‘typical’ expansionary quarter the cyclical component increases by one percentage point (sample standard deviations of increases in the cyclical component are 0.95% and 0.94% for the UK and the US, respectively.) Let us also consider an expansion comprising four consecutive expansionary quarters. According to the estimation corresponding, for example, to the UK, the change in the unemployment rate in the quarter before the
beginning of the expansion will be , that is, an
approximate decrease of 0.02 percentage points. The change in the
unemployment rate in the quarter when the expansion begins will be
, that is, an approximate decrease of
0.12 percentage points. Table 6 shows quarterly and accumulated reductions in
the unemployment rate in the different quarters for both countries. The
unemployment rate decreases slightly in the quarter immediately preceding the
beginning of the expansion. Then it strongly decreases over the four ex-
pansionary quarters. In the following quarters, the UK unemployment rate still
decreases strongly, but the additional decrease in the US unemployment rate is
weaker. The overall effect of these four successive expansionary quarters is
remarkably similar in both countries: a decrease in the unemployment rate of
2.00 percentage points for the UK and a decrease of 2.22 points for the US. Of
course, this is just a hypothetical exercise to examine the effects of a given
expansion and this variation will not be permanent insofar as the cyclical
component does not remain stable indefinitely.
Table 6: Predicted changes in unemployment
Quarter UK US
-1 0.02 0.02 0.07 0.07
0 0.12 0.15 0.29 0.35
1 0.23 0.38 0.43 0.78
2 0.33 0.70 0.52 1.30
3 0.37 1.08 0.49 1.78
4 0.34 1.42 0.27 2.06
5 0.28 1.70 0.13 2.18
6 0.18 1.88 0.04 2.22
7 0.09 1.97 – –
8 0.03 2.00 – –
9 – – – –
The entries are the expected reductions in the unemployment rate over a four-quarter expansion when the cyclical component increases by one percentage point each quarter, and zero elsewhere. The first column indicates the number of quarters since the beginning of the expansion; that is, expansion begins in quarter 0 and ends in quarter 3.
The results reported above show a clear relationship between business cycles and the unemployment rate. But this relationship could be different by gender. It has been long argued that labor markets may differ greatly by gender;
participation rates, wages, sector employment shares, among many other
aspects, could be different for men and women, and the influence of cyclical
shocks on the unemployment rate could also differ. Additionally, there has been
discussion over the decline or even disappearance of business cycles in recent
decades. If business cycles are much weaker than they used to be, the
influence of cyclical shocks on the unemployment rate could also have
diminished significantly. In order to study these two possibilities, new
regressions similar to (2) have been carried out but: i) using male and female
unemployment rates instead of the total unemployment rate; ii) using two sub-
samples approximately made up of the first two thirds and the last third of the
total sample. Table 7 shows the results of these regressions and Tables 8 and 9
show the dynamic effect, under these new circumstances, of an expansion
comprising four successive increases in the cyclical component equal to 0.01,
for the UK and the US respectively.
Table 7: Additional regressions
UK US
Men Women 1971-1995 1996-2008 Men Women 1948-1987 1988-2008
0.025
(0.035)
0.005
(0.026)
0.051
(0.036)
-0.051
(0.032)
0.009
(0.017)
0.004
(0.016)
0.012
(0.020)
0.002
(0.024)
-6.45***
(2.37)
-7.55***
(1.94) -5.83**
(2.43) -7.62***
(1.87)
-12.80***
(2.65)
-4.68***
(1.63)
-9.73***
(2.22)
-21.52***
(5.92)
-25.69***
(2.03)
-15.87***
(2.55)
-22.22***
(1.87)
-21.02***
(4.40)
-14.44***
(3.40) -4.92**
(2.17) -10.70***
(2.79) -13.88***
(2.29) -14.15***
(3.09) -14.25***
(2.39) -15.67***
(3.65)
-12.59***
(3.53)
-5.76***
(2.15)
-10.50***
(2.71)
-9.93***
(1.74)
-7.63***
(2.29)
-8.49***
(1.50)
-11.38***
(3.65)
-12.23***
(2.54)
-4.15***
(1.59)
-8.39***
(2.17)
-5.77***
(1.86)
-4.53***
(1.68)
-8.69**
(4.27)
-8.17***
(2.16) -3.67**
(1.51) -6.78***
(1.68)
-6.63***
(1.92)
-2.76**
(1.35)
-4.86***
(1.79)
51% 16% 51% 23% 70% 52% 73% 53%
Results of the regressions for both UK and US, where is the change in the unemployment rate in quartert, is the change in the cyclical component in quarter t, and m andn take different values in the different regressions. Values in parentheses are Newey-West robust standard errors.The superscripts *, ** and *** indicate significance at the 10%, 5% and 1% levels, respectively.
Table 8: Predicted changes in unemployment (UK)
Men Women 1971-1995 1996-2008
Quarter
-1 0.04 0.04 - - - -
0 0.17 0.21 0.04 0.04 0.05 0.05 0.27 0.27
1 0.31 0.52 0.09 0.13 0.15 0.20 0.27 0.53
2 0.44 0.96 0.15 0.28 0.26 0.46 0.27 0.80
3 0.50 1.45 0.19 0.47 0.34 0.80 0.27 1.06
4 0.45 1.90 0.18 0.65 0.31 1.11 - -
5 0.37 2.27 0.16 0.81 0.25 1.37 - -
6 0.25 2.52 0.10 0.91 0.15 1.52 - -
7 0.12 2.64 0.06 0.97 0.07 1.58 - -
8 0.04 2.68 0.02 0.99 - - - -
9 - - - -
The entries are the expected reductions in the UK unemployment rate over a four-quarter expansion when the cyclical component increases by one percentage point each quarter, and zero elsewhere. The first column indicates the number of quarters since the beginning of the expansion; that is, the expansion begins in quarter 0 and ends in quarter 3.
Table 9: Predicted changes in unemployment (US)
Men Women 1948-1987 1988-2008
Quarter
-1 0.07 0.07 0.05 0.05 0.06 0.06 – –
0 0.32 0.39 0.21 0.27 0.29 0.35 0.21 0.21
1 0.46 0.85 0.35 0.62 0.43 0.78 0.36 0.57
2 0.56 1.41 0.43 1.05 0.51 1.29 0.48 1.05
3 0.54 1.96 0.37 1.43 0.48 1.78 0.57 1.62
4 0.29 2.24 0.21 1.64 0.26 2.04 0.36 1.97
5 0.15 2.39 0.07 1.71 0.12 2.16 0.20 2.17
6 0.05 2.44 – – 0.03 2.19 0.08 2.26
7 – – – – – – – –
8 – – – – – – – –
9 – – – – – – – –
The entries are the expected reductions in the US unemployment rate over a four-quarter expansion when the cyclical component increases by one percentage point each quarter, and zero elsewhere. The first column indicates the number of quarters since the beginning of the expansion; that is, the expansion begins in quarter 0 and ends in quarter 3.
One main conclusion emerges from these tables. Male unemployment is more sensitive to cyclical conditions than female unemployment. This is the case in both the UK and the US, but the difference is much larger in the UK. An expansionary period comprising four successive increases of one percentage point in the cyclical component would lead to a decrease in the UK male unemployment rate of 2.68 percentage points, while the female unemployment rate would only decrease by 0.99 percentage points. The difference is much larger than in the US, where the men’s unemployment rate would decrease by 2.44 percentage points, while women’s rate would decrease by 1.71 points.
With regard to changes over time in the response of unemployment to cyclical shocks, in the first sub-period UK unemployment was more responsive to cyclical conditions than in the second sub-period. The expansion comprising four consecutive expansionary quarters would have resulted in a decrease of 1.58 percentage points in the first sub-period and 1.06 points in the second.
However, in the US the reductions are 2.00 and 2.22, respectively. Therefore, the change over time does not seem to occur in the US, where the sensitivity of the unemployment rate is very similar in both sub-periods.
One possible explanation for these facts could be the difference in em- ployment by sector between men and women and over time. The ratio of employment in goods-providing sectors to employment in service-providing sectors is always much higher among men than among women, both in the UK and the USA. If unemployment in the
first sectors were more sensitive tocyclical shocks than in the latter, one should expect male unemployment to be more sensitive to cyclical conditions than female unemployment, as turns out to be the case in both countries. The evolution of this ratio can also explain the different response from the UK unemployment rate over time. While the mean of this ratio is 59% in the first sub-period, it decreases to 33% in the second.
This reduction may be associated to fact that the unemployment rate is less sensitive to cyclical conditions observed in the second sub-period.
Nevertheless, in the US the mean of this ratio also decreases from 63% to 29%
and no major changes are observed in the response of the unemployment rate
to cyclical movements. Other factors, such as changes in labor legislation or
dismissal procedures, probably play an important role over time.
4. Markov switching regime models
In the preceding section we investigated the link between unemployment and GDP by means of standard linear regression equations. However, such approach does not take into account the possible nonlinear relationships be- tween the variables.
As seen in Section 2, unemployment series seem to be asymmetric. In what follows,
first we formally test for unconditional symmetry of the unemploymentrate series. In order to do so, we employ two recently proposed tests: the Bai and Ng (2005) and Racine et al. (2007) procedures, see Table 10.
Table 10: Unconditional symmetry tests
and are the Bai-Ng (2005) test statistics, whereas is the Racine et al. (2007) statistic p-value.
The superscripts *, ** and *** indicate significance at the 10%, 5% and 1% levels, respectively.
The Bai-Ng test does not allow us to reject the null hypothesis of symmetry for any of the UK unemployment rate series (there is just a marginal 10% level rejection for the male series using the statistic), whereas the Racine et al.
test strongly rejects the null of symmetry for the total and male unemployment rate series. In addition, we find strong evidence against symmetry for all the US variables when using both testing procedures. These results could be explained by either asymmetric disturbances in the linear data generating processes, or possible nonlinear mechanisms driving the dynamics of the changes in the unemployment rates.
In order to delve deeper into this question, next we test for linearity using the Hong and Lee (2007) test. The results in Table 11 are rather conclusive. The
Series (UK)
(all) 1.507 2.305 0.000***
(men) 1.652* 3.051 0.002***
(women) 0.328 0.644 0.810
Series (US)
(all) 2.435** 7.478** 0.032**
(men) 2.427** 6.724** 0.025**
(women) 1.996** 5.099* 0.010**
null hypothesis of linearity cannot be rejected for any UK variable. However, it is clearly rejected for all the US unemployment rate changes series.
Table 11: Hong-Lee (2007) linearity test
The entries are the p-values of the Hong-Lee test. The superscripts *, ** and *** indicate significance at the 10%, 5% and 1% levels, respectively.
Given the results of the symmetry and linearity tests, model (2) could be a plausible representation of the dynamics of the total and male UK unemployment rate changes series, whereas it is an inappropriate mechanism to explain the complex movements in US variables. Hence, alternatively, we estimate a set of Markov switching (MS) regime regression models.
4A stationary time series is assumed to have been generated by an MS model with
Mregimes and
plags in the exogenous regressors if:
(3)
where , , and the values of the
intercept and the multipliers depend on the current regime represented by . If we allow for regime-dependent heteroskedasticity, then we replace the
assumption by .
This type of models was initially developed by Goldfeld and Quandt (1973), in response to economists’ view of different behavior of variables during different
4The universe of available nonlinear models is large (TAR, STAR, ESTAR, LSTAR, etc.) Our goal however is not tofit the “best” nonlinear model, but rather to show how our conclusions can be enriched by alternative approaches.
Series (UK)
(all) 0.114 0.090* 0.074* 0.069* 0.068*
(men) 0.122 0.128 0.144 0.154 0.154
(women) 0.486 0.334 0.211 0.150 0.114
Series (US)
(all) 0.038** 0.049** 0.058* 0.055* 0.046**
(men) 0.000*** 0.001*** 0.003*** 0.007*** 0.010***
(women) 0.009*** 0.004*** 0.002*** 0.001*** 0.001***
cycle phases. The phase is represented by an unobservable state , which takes a value of 1 (expansion) or 0 (contraction.)
5The simplest specification is that is the realization of a two-state Markov chain, where the probability of a change in regime depends on the past only through the value of the most recent regime:
. The formulation of the problem, in which all parameters of interest are calcu- lated as a by-product of an iterative algorithm similar in spirit to a Kalman filter, is due to Hamilton (1989.) The maximum likelihood estimates have been obtained by the EM algorithm. Results of the selected models using Schwarz’s criterion are displayed in Tables 12 and 13.
Table 12: MS estimates (UK)
(all) (men) (women)
Expansion Contraction Expansion Contraction Expansion Contraction
-0.11***(0.02) 0.19***
(0.02) -0.10***
(0.03) 0.23***
(0.03) -0.09***
(0.02) 0.16***
(0.02)
-7.54**
(3.47) -3.75**
(1.57) -6.37*
(3.28) -4.18**
(1.81) -5.13*
(2.80) -3.06*
(1.58)
-13.39***
(2.90)
-9.77**
(1.65)
-9.76***
(2.90)
-14.61***
(1.89)
-9.17***
(2.79)
-4.72***
(1.66)
-9.94***
(3.04) -11.25***
(1.57) -8.98***
(2.64) -19.27***
(1.81) -7.51***
(2.42) -5.20***
(1.64)
-7.64**
(2.83)
-11.09***
(1.58)
-6.89**
(2.76)
-17.82***
(1.82)
-7.60**
(2.64)
-5.74***
(1.56)
-7.93***
(2.45) -7.77***
(1.83) -7.41**
(2.99) -12.98***
(1.89) -4.43*
(2.26) -4.43**
(1.95)
-4.98*
(2.93)
-4.14**
(1.72)
-3.95
(3.15)
-4.31**
(1.76)
-4.87**
(2.45)
-2.47
(1.76)
0.14 0.13 0.19 0.12 0.14 0.12
The entries are the estimated parameters for each regime. Values in parentheses are Newey-West robust standard errors. The superscripts *, ** and *** indicate significance at the 10%, 5% and 1% levels, respectively.
5As typically, we have chosen to specify a binary state variable, although we could represent a more flexible framework by allowing, for instance, for an additional intermediate state between pure expansion and pure contraction.
Table 13: MS estimates (US)
(all) (men) (women)
Expansion Contraction Expansion Contraction Expansion Contraction
-0.08***(0.01) 0.05*
(0.03) -0.09***
(0.02) 0.05*
(0.03) -0.03**
(0.02) 0.04
(0.04)
-6.33***
(1.79) -3.51
(2.35) -5.17**
(2.31) -5.46**
(2.63) -7.33***
(2.26) 2.51
(3.22)
-8.28***
(1.83) -27.83***
(2.45) -10.38***
(2.13) -32.52***
(2.69) -9.89***
(2.17) -27.55***
(3.27)
-1.28
(1.87) -19.64***
(2.35) -2.06
(2.39) -19.25***
(2.63) -2.57
(2.47) -23.44***
(3.23)
-2.84
(1.92)
-8.89***
(2.38)
-0.95
(2.21)
-12.83***
(2.74)
-8.68***
(2.31)
-5.04
(3.25)
0.11 0.20 0.13 0.22 0.17 0.20
The entries are the estimated parameters for each regime. Values in parentheses are Newey-West robust standard errors. The superscripts *, ** and *** indicate significance at the 10%, 5% and 1% levels, respectively.
Concerning UK results, multiplier estimates for the total unemployment rate do not largely differ among regimes and standard deviation estimates are rather close. However, behind this result, a different fact is found for male and female unemployment. In absolute values, the estimates are somewhat larger in expansions than in contractions for female unemployment, while the opposite is true for male unemployment. In the case of the latter, the absolute estimates are much larger in contractions than in expansions. This marked difference between regimes implies deep asymmetry: the male unemployment rate is much more sensitive to contractions than to expansions. The same occurs for US unemployment variables and the differences between expansions and contractions are considerable in all cases. The symmetry test results shown in Table 10 are thus confirmed; absolute estimates are much higher in contractions than in expansions, implying US unemployment is much more sensitive to contractions than expansions.
In order to assess the effect of cyclical movements on the unemployment
rate from a different perspective, simulations of the effects of hypothetical
expansions and contractions on unemployment are also performed. Let us once
again consider an expansion (contraction) period comprising four quarters with
increases in the cyclical component equal to 1% (-1%.) Their effects on
unemployment rates are shown in Table 14. Two main conclusions can be
derived from this table. First, expansions diminish the unemployment rate to a smaller extent than contractions increase it in the case of both countries. In some cases the difference is very large; for example, an expansion period reduces the UK male unemployment rate by 2.67 percentage points, while a contraction period increases it by 4.99 points. Second, male unemployment in contractions is much more sensitive than female unemployment; for example, a contraction period in the UK increases the male unemployment rate by 4.99 percentage points, whereas the female unemployment rate only rises by 2.50 points.
Table 14: Predicted accumulated changes in unemployment (MS models)
UK US
Expansion Contraction Expansion Contraction
(all) 3.05 3.59 1.29 2.71
(men) 2.67 4.99 1.35 3.14
(women) 2.37 2.50 1.37 2.43
The entries are the expected accumulated reductions (increments) in the unemployment rate, up to the 7th (UK) and 5th (US) quarter, over a four-quarter expansion (contraction) when the cyclical component increases (decreases) by one percentage point each quarter and zero elsewhere.
Therefore, the simulations shown in Table 14 also seem to point to two important features in the relationship between unemployment and business cycles: the asymmetric relationship of unemployment with expansions and contractions and the differences between male and female unemployment over the business cycle. Though the evidence presented here seems to be fairly strong and robust, further research should be undertaken on these two points using different approaches.
5. Conclusions
The study of the relationship between unemployment and business cycles has
received the attention of economic research for many decades. However, the
literature is very sparse on important related topics such as the dynamics in-
volved, stability over time, the existence of possible differences by gender and
the possible asymmetric response of unemployment to cyclical movements.
This scarcity is extreme when it comes to integrating these topics in a joint analysis.
In order to mitigate this situation, this paper examines the relationship between unemployment and cyclical conditions over the last few decades in two main economies: the United Kingdom, and the United States of America. A strong and definite dynamic relationship is found in both countries that lasts for several quarters and displays a reasonable and logical time profile. These findings allow us to simulate the effects of a hypothetical expansion comprising four successive expansionary quarters with a cyclical component equal to the typical value of 1%. The results obtained are similar for both economies; the expansion would decrease the unemployment rate by 2.0 and 2.2 percentage points in the UK and the US respectively. A closer look shows that there are clear differences by gender and over time. The effect of cyclical shocks is clearly stronger on male unemployment than on female unemployment, especially in the UK. Over time, the effect on total unemployment has decreased noticeably in the UK, maybe due to the growing importance of services or to the role of the public sector.
Numerous contributions have reported empirical evidence on unconditional
asymmetry of labor variables in many countries. Preliminary evidence suggests
that this is the case with the UK and US unemployment rates. Markov switching
regime models are estimated to account for this feature. The estimated models
effectively show an asymmetric response on behalf of the unemployment rate to
cyclical movements. The unemployment rate usually reacts more strongly to
negative cyclical shocks (contractions) than to positive ones (expansions), and
this difference is particularly pronounced for male unemployment.
6. References
Acemoglu, D.; Scott, A., 1994.Asymmetries in the cyclical behavior of UK labor markets,
The Economic Journal, 104, 1303–23.Alewell, D.; Schott, E.; Wiegand, E. F., 2009. The impact of dismissal protection on employers’ cost of terminating employment relations in Germany - An overview of empirical research and its white spots.
Comparative Labor Law & Policy Journal, 30,667–691
Andrews, D. W. K., 1991. Heteroskedasticity and autocorrelation consistent covariance matrix estimation.
Econometrica, 59, 817-854.Bai, J.; Ng, S., 2005. Tests for skewness, kurtosis, and normality for time series data.
Journal of Business and Economic Statistics, 23, 49–60.
Bierens, H. J.; Guo, S., 1993. Testing stationarity and trend stationarity against the unit root hypothesis.
Econometric Reviews, 12, 1–32.Blank, R. M., 1989. Disaggregating the effect of the business cycle on the distribution of income.
Economica, 56, 141–163.Breitung, J., 2002. Nonparametric tests for unit roots and cointegration.
Journal of Econometrics, 108, 343–363.Blundell, R.; MaCurdy, T., 1999. Labor supply: A review of alternative approaches, in O. Ashenfelter and D. Card, eds.,
Handbook of Labor Economics, Volume 3A, 1559–1695. Amsterdam: Elsevier.
Burns, A. F.; Mitchell, W. C., 1946.
Measuring Business Cycles. New York: NationalBureau of Economic Research.
Clark, K. B.; Summers, L. H., 1981. Demographic differences in cyclical employment variation.
NBER Working Paper Series, w0514.Crespo Cuaresma, J., 2003. Okun’s law revisited.
Oxford Bulletin of Economics and Statistics, 65, 439–451.DeLong, J.B.; Summers, L. H., 1986. Are business cycles symmetrical?, in R. J.
Gordon, ed.,
The American Business Cycle. Continuity and Change, 166–179. Chicago:The University of Chicago Press.
Elliott, G.; Rothenberg, T. J.; Stock, J. H., 1996. Efficient Tests for an Autoregressive Unit Root.
Econometrica, 64, 813–836.Granger, C. W. J., 1995. Modeling nonlinear relationships between extended memory variables.
Econometrica, 63, 265–279.Hamilton, J. D., 1989. A new approach to the economic analysis of non-stationary time
series and the business cycle.
Econometrica, 57, 357–384.Hodrick, R. J.; Prescott, E. C., 1980. Postwar U.S. business cycles: An empirical investigation.
Discussion Papers451, mss. Pittsburgh: Carnegie-Mellon University.
Hodrick, R. J.; Prescott, E. C., 1997. Postwar U.S. business cycles: an empirical investigation.
Journal of Money, Credit, and Banking, 29, 1–16.Holmes, M. J.; Silverstone, B., 2006. Okun’s law, asymmetries and jobless recoveries in the United States: A Markov-switching approach.
Economics Letters, 92, 293–299.Hong, Y.; Lee, Y. J., 2007. An improved generalized spectral test for conditional mean specification in time series with conditional heteroskedasticity of unknown form.
Econometric Theory, 23, 106–1547.
Huang, H.; Chang, Y., 2005. Investigating Okun’s law by the structural break with threshold approach: Evidence from Canada.
Manchester School, 73, 599–611.Huang, H.; Lin, S., 2006. A flexible nonlinear inference to Okun’s relationship.
Applied Economics Letters, 13, 325–331.Hussey, R., 1992. Nonparametric evidence on asymmetry in business cycles using aggregate employment time series.
Journal of Econometrics, 51, 217–231.Kandill, M.; Woods, J. G., 2003. Is the business cycle gender neutral? A sectoral investigation.
Equal Opportunities International, 22, 1–24.Keynes, J.M., 1936.
The General Theory of Employment, Interest and Money. London:Macmillan.
Killingsworth, M., 1983.
Labor Supply. New York: Cambridge University Press.Koop, G.; Potter, S. M., 1999. Dynamic asymmetries in U.S. unemployment.
Journal of Business and Economic Statistics, 17, 298–312.Kwiatkowski, D.; Phillips, P. C. B.; Schmidt, P.; Shin, Y., 1992. Testing the null hypothesis of stationarity against the alternative of a unit root.
Journal of Econometrics,54, 159–178.
McKay, A.; Reis, R., 2008. The brevity and violence of contractions and expansions.
Journal of Monetary Economics, 55, 738–751.
Mitchell, W.C., 1927.
Business cycles: The problem and its setting. New York:National Bureau of Economic Research.
Mittnik, S.; Niu, Z., 1994. Asymmetries in business cycles: Econometric techniques and empirical evidence, in W. Semmler, ed.,
Business Cycles: Theory and Empirical Methods, 331–350. Boston: Kluwer Academic Publishers,.Neftçi, S. N., 1984. Are economic times series asymmetric over the business cycle?.
Journal of Political Economy, 92, 307–28.
F
UNDACIÓN DE LASC
AJAS DEA
HORROS DOCUMENTOS DE TRABAJOÚltimos números publicados
159/2000 Participación privada en la construcción y explotación de carreteras de peaje Ginés de Rus, Manuel Romero y Lourdes Trujillo
160/2000 Errores y posibles soluciones en la aplicación del Value at Risk Mariano González Sánchez
161/2000 Tax neutrality on saving assets. The spahish case before and after the tax reform Cristina Ruza y de Paz-Curbera
162/2000 Private rates of return to human capital in Spain: new evidence F. Barceinas, J. Oliver-Alonso, J.L. Raymond y J.L. Roig-Sabaté 163/2000 El control interno del riesgo. Una propuesta de sistema de límites
riesgo neutral
Mariano González Sánchez
164/2001 La evolución de las políticas de gasto de las Administraciones Públicas en los años 90 Alfonso Utrilla de la Hoz y Carmen Pérez Esparrells
165/2001 Bank cost efficiency and output specification Emili Tortosa-Ausina
166/2001 Recent trends in Spanish income distribution: A robust picture of falling income inequality Josep Oliver-Alonso, Xavier Ramos y José Luis Raymond-Bara
167/2001 Efectos redistributivos y sobre el bienestar social del tratamiento de las cargas familiares en el nuevo IRPF
Nuria Badenes Plá, Julio López Laborda, Jorge Onrubia Fernández
168/2001 The Effects of Bank Debt on Financial Structure of Small and Medium Firms in some Euro- pean Countries
Mónica Melle-Hernández
169/2001 La política de cohesión de la UE ampliada: la perspectiva de España Ismael Sanz Labrador
170/2002 Riesgo de liquidez de Mercado Mariano González Sánchez
171/2002 Los costes de administración para el afiliado en los sistemas de pensiones basados en cuentas de capitalización individual: medida y comparación internacional.
José Enrique Devesa Carpio, Rosa Rodríguez Barrera, Carlos Vidal Meliá
172/2002 La encuesta continua de presupuestos familiares (1985-1996): descripción, representatividad y propuestas de metodología para la explotación de la información de los ingresos y el gasto.
Llorenc Pou, Joaquín Alegre
173/2002 Modelos paramétricos y no paramétricos en problemas de concesión de tarjetas de credito.
Rosa Puertas, María Bonilla, Ignacio Olmeda
174/2002 Mercado único, comercio intra-industrial y costes de ajuste en las manufacturas españolas.
José Vicente Blanes Cristóbal
175/2003 La Administración tributaria en España. Un análisis de la gestión a través de los ingresos y de los gastos.
Juan de Dios Jiménez Aguilera, Pedro Enrique Barrilao González 176/2003 The Falling Share of Cash Payments in Spain.
Santiago Carbó Valverde, Rafael López del Paso, David B. Humphrey Publicado en “Moneda y Crédito” nº 217, pags. 167-189.
177/2003 Effects of ATMs and Electronic Payments on Banking Costs: The Spanish Case.
Santiago Carbó Valverde, Rafael López del Paso, David B. Humphrey
178/2003 Factors explaining the interest margin in the banking sectors of the European Union.
Joaquín Maudos y Juan Fernández Guevara
179/2003 Los planes de stock options para directivos y consejeros y su valoración por el mercado de valores en España.
Mónica Melle Hernández
180/2003 Ownership and Performance in Europe and US Banking – A comparison of Commercial, Co- operative & Savings Banks.
Yener Altunbas, Santiago Carbó y Phil Molyneux
181/2003 The Euro effect on the integration of the European stock markets.
Mónica Melle Hernández
182/2004 In search of complementarity in the innovation strategy: international R&D and external knowledge acquisition.
Bruno Cassiman, Reinhilde Veugelers
183/2004 Fijación de precios en el sector público: una aplicación para el servicio municipal de sumi- nistro de agua.
Mª Ángeles García Valiñas
184/2004 Estimación de la economía sumergida es España: un modelo estructural de variables latentes.
Ángel Alañón Pardo, Miguel Gómez de Antonio
185/2004 Causas políticas y consecuencias sociales de la corrupción.
Joan Oriol Prats Cabrera
186/2004 Loan bankers’ decisions and sensitivity to the audit report using the belief revision model.
Andrés Guiral Contreras and José A. Gonzalo Angulo
187/2004 El modelo de Black, Derman y Toy en la práctica. Aplicación al mercado español.
Marta Tolentino García-Abadillo y Antonio Díaz Pérez 188/2004 Does market competition make banks perform well?.
Mónica Melle
189/2004 Efficiency differences among banks: external, technical, internal, and managerial Santiago Carbó Valverde, David B. Humphrey y Rafael López del Paso
190/2004 Una aproximación al análisis de los costes de la esquizofrenia en españa: los modelos jerár- quicos bayesianos
F. J. Vázquez-Polo, M. A. Negrín, J. M. Cavasés, E. Sánchez y grupo RIRAG 191/2004 Environmental proactivity and business performance: an empirical analysis
Javier González-Benito y Óscar González-Benito
192/2004 Economic risk to beneficiaries in notional defined contribution accounts (NDCs) Carlos Vidal-Meliá, Inmaculada Domínguez-Fabian y José Enrique Devesa-Carpio
193/2004 Sources of efficiency gains in port reform: non parametric malmquist decomposition tfp in- dex for Mexico
Antonio Estache, Beatriz Tovar de la Fé y Lourdes Trujillo 194/2004 Persistencia de resultados en los fondos de inversión españoles
Alfredo Ciriaco Fernández y Rafael Santamaría Aquilué
195/2005 El modelo de revisión de creencias como aproximación psicológica a la formación del juicio del auditor sobre la gestión continuada
Andrés Guiral Contreras y Francisco Esteso Sánchez
196/2005 La nueva financiación sanitaria en España: descentralización y prospectiva David Cantarero Prieto
197/2005 A cointegration analysis of the Long-Run supply response of Spanish agriculture to the com- mon agricultural policy
José A. Mendez, Ricardo Mora y Carlos San Juan
198/2005 ¿Refleja la estructura temporal de los tipos de interés del mercado español preferencia por la li- quidez?
Magdalena Massot Perelló y Juan M. Nave
199/2005 Análisis de impacto de los Fondos Estructurales Europeos recibidos por una economía regional:
Un enfoque a través de Matrices de Contabilidad Social M. Carmen Lima y M. Alejandro Cardenete
200/2005 Does the development of non-cash payments affect monetary policy transmission?
Santiago Carbó Valverde y Rafael López del Paso
201/2005 Firm and time varying technical and allocative efficiency: an application for port cargo han- dling firms
Ana Rodríguez-Álvarez, Beatriz Tovar de la Fe y Lourdes Trujillo 202/2005 Contractual complexity in strategic alliances
Jeffrey J. Reuer y Africa Ariño
203/2005 Factores determinantes de la evolución del empleo en las empresas adquiridas por opa Nuria Alcalde Fradejas y Inés Pérez-Soba Aguilar
204/2005 Nonlinear Forecasting in Economics: a comparison between Comprehension Approach versus Learning Approach. An Application to Spanish Time Series
Elena Olmedo, Juan M. Valderas, Ricardo Gimeno and Lorenzo Escot
205/2005 Precio de la tierra con presión urbana: un modelo para España Esther Decimavilla, Carlos San Juan y Stefan Sperlich
206/2005 Interregional migration in Spain: a semiparametric analysis Adolfo Maza y José Villaverde
207/2005 Productivity growth in European banking
Carmen Murillo-Melchor, José Manuel Pastor y Emili Tortosa-Ausina
208/2005 Explaining Bank Cost Efficiency in Europe: Environmental and Productivity Influences.
Santiago Carbó Valverde, David B. Humphrey y Rafael López del Paso
209/2005 La elasticidad de sustitución intertemporal con preferencias no separables intratemporalmente: los casos de Alemania, España y Francia.
Elena Márquez de la Cruz, Ana R. Martínez Cañete y Inés Pérez-Soba Aguilar
210/2005 Contribución de los efectos tamaño, book-to-market y momentum a la valoración de activos: el caso español.
Begoña Font-Belaire y Alfredo Juan Grau-Grau
211/2005 Permanent income, convergence and inequality among countries José M. Pastor and Lorenzo Serrano
212/2005 The Latin Model of Welfare: Do ‘Insertion Contracts’ Reduce Long-Term Dependence?
Luis Ayala and Magdalena Rodríguez
213/2005 The effect of geographic expansion on the productivity of Spanish savings banks Manuel Illueca, José M. Pastor and Emili Tortosa-Ausina
214/2005 Dynamic network interconnection under consumer switching costs Ángel Luis López Rodríguez
215/2005 La influencia del entorno socioeconómico en la realización de estudios universitarios: una aproxi- mación al caso español en la década de los noventa
Marta Rahona López
216/2005 The valuation of spanish ipos: efficiency analysis Susana Álvarez Otero
217/2005 On the generation of a regular multi-input multi-output technology using parametric output dis- tance functions
Sergio Perelman and Daniel Santin
218/2005 La gobernanza de los procesos parlamentarios: la organización industrial del congreso de los di- putados en España
Gonzalo Caballero Miguez
219/2005 Determinants of bank market structure: Efficiency and political economy variables Francisco González
220/2005 Agresividad de las órdenes introducidas en el mercado español: estrategias, determinantes y me- didas de performance
David Abad Díaz
221/2005 Tendencia post-anuncio de resultados contables: evidencia para el mercado español Carlos Forner Rodríguez, Joaquín Marhuenda Fructuoso y Sonia Sanabria García 222/2005 Human capital accumulation and geography: empirical evidence in the European Union
Jesús López-Rodríguez, J. Andrés Faíña y Jose Lopez Rodríguez
223/2005 Auditors' Forecasting in Going Concern Decisions: Framing, Confidence and Information Proc- essing
Waymond Rodgers and Andrés Guiral
224/2005 The effect of Structural Fund spending on the Galician region: an assessment of the 1994-1999 and 2000-2006 Galician CSFs
José Ramón Cancelo de la Torre, J. Andrés Faíña and Jesús López-Rodríguez
225/2005 The effects of ownership structure and board composition on the audit committee activity: Span- ish evidence
Carlos Fernández Méndez and Rubén Arrondo García
226/2005 Cross-country determinants of bank income smoothing by managing loan loss provisions Ana Rosa Fonseca and Francisco González
227/2005 Incumplimiento fiscal en el irpf (1993-2000): un análisis de sus factores determinantes Alejandro Estellér Moré
228/2005 Region versus Industry effects: volat