REDISTRIBUTIVE CONFLICTS AND PREFERENCES FOR TAX SCHEMES IN EUROPE
ANTONIO M. JAIME-CASTILLO JOSE L. SAEZ-LOZANO
FUNDACIÓN DE LAS CAJAS DE AHORROS DOCUMENTO DE TRABAJO
Nº 574/2010
De conformidad con la base quinta de la convocatoria del Programa de Estímulo a la Investigación, este trabajo ha sido sometido a eva- luación externa anónima de especialistas cualificados a fin de con- trastar su nivel técnico.
ISSN: 1988-8767
La serie DOCUMENTOS DE TRABAJO incluye avances y resultados de investigaciones dentro de los pro- gramas de la Fundación de las Cajas de Ahorros.
Las opiniones son responsabilidad de los autores.
Redistributive Conflicts and Preferences for Tax Schemes in Europe
Antonio M. Jaime-Castillo*
Jose L. Saez-Lozano**
Abstract:
Meltzer and Richard (1981) state that democracy will boost redistribution of income from the rich to the poor. Given that the median-income voter is poorer than the average-income voter, a majority of voters will vote for redistribution. Although the assertion of a positive relationship between democracy and equalization of income has been highly criticized on both theoretical and empirical grounds, most empirical studies have focused on responses to the conventional question about whether the government should reduce income differences. In this paper we propose a different specification of the Meltzer and Richard hypothesis in which individuals do not have to vote for a general tax rate, but for taxes for particular groups. To test this theoretical model empirically, we use data about preferences for taxation taken from the ISSP (Role of Government), in which individuals must express their agreement with the taxes paid by different income groups. We propose a measure of targeted redistribution through taxation at the individual level that is used as the dependent variable in further analyses. Several hypotheses about preferences for tax schemes are tested. At the individual level, we test whether preferences are explained by self-interest variables such as socio-economic status and labor market situation. At the aggregate level, we test whether preferences for tax schemes are related to inequality and tax burden by country. To analyze these issues, we use a multilevel methodology. Empirical evidence shows that preferences for tax schemes are mainly driven by self-interest, although there are important differences by countries.
Keywords: redistribution, conflicts, taxes, preferences, welfare-regimes.
JEL Classification: D63; D74; H24; I38
*Department of State Law and Sociology, University of Málaga - C/ Ejido, 6. Málaga. E-29071.
Spain. E-mail: [email protected]
**Department of International and Spanish Economy, University of Granada
Acknowledgements: A previous version of this paper was presented at the 5th ECPR General Conference in Potsdam, Germany (2009). The authors gratefully acknowledge financial support from the Centro de Estudios Andaluces (PRY126/08) and the Instituto de Estudios Fiscales.
1. Introduction
Meltzer and Richard (1981) state that democracy will boost redistribution of income from the rich to the poor. Given that the median-income voter is poorer than the average- income voter, a majority of voters will vote for redistribution and any increase in inequality will produce a higher demand for redistribution. However, the assertion of a positive relationship between democracy and equalization of income has been highly criticized on both theoretical and empirical grounds. Nevertheless, in the last decade there has been a great deal of theoretical and empirical research in Political Economics about inequality and preferences for redistribution (Lübker, 2007). Following a longstanding tradition, most empirical studies have focused on responses to the conventional survey question about whether the government should reduce income differences. However, some important concerns arise when we examine this approach in more detail. First, saying that the government should reduce differences in income does not tell us very much about the preferred redistributive policies and how this equalization will affect different groups, particularly those in the middle and at the top of the income ladder. Second, this approach is silent about whether redistribution will take place through public spending or taxation.
Third, it does not take into account the many targeted redistributive policies in contemporary public sectors and their collateral implications.
For these reasons, it would be advisable to think about different ways to analyze empirically preferences for redistribution. An alternative research strategy is to analyze preferences for different public policies with different redistributive implications. This strategy includes preferences regarding both spending and taxation policies. Taking this approach, our paper focuses specifically on the evaluation of taxation policies, given their impact on redistribution. In our empirical work, individuals do not have to express their preferences about equalization of income, but they do have to evaluate the taxes paid by different income groups. The aim of this alternate specification is to know the targeted group to which an individual wants to redistribute. We propose a theoretical measure of targeted redistribution through taxation (TDT) and test this theoretical model empirically using data about preferences for taxation taken from the ISSP (Role of Government). After
computing this measure of targeted redistribution, several hypotheses about preferences for tax schemes are tested. At the individual level, we test whether preferences are explained by self-interest variables such as socio-economic status and labor market situation. At the aggregate level, we test whether preferences for tax schemes are related to inequality and tax burden by country.
The rest of the paper is organized as follows. In the next section, we present an overview of the theoretical literature about preferences for redistribution. After that, we discuss some important empirical facts and the idea of preferences for taxes. These serve as the basis for introducing a measure of preferences for targeted redistribution by taxes and for proposing our hypotheses. In the fourth section we present the data and the multilevel approach we have used to tackle our research question. The fifth section discusses the main empirical findings. Finally, the last section contains conclusions and implications of our results for further investigation.
2. Overview of the literature
There are two ways to explain preferences for redistribution and welfare policies in the literature. On the one hand, the self-interest approach states that redistributive preferences are negatively correlated with income. On the other hand, the ideological approach states that redistributive preferences are mainly shaped by political beliefs and value orientations at the individual level and cultural factors at the national level. Within the first approach, the classical model by Meltzer and Richard (1981) argues that there is a positive relationship between inequality and demand for redistribution and forecasts that democracy will boost redistribution of income from the rich to the poor. However, more recently, Benabou (2000) argues that there is not a linear relationship between inequality and demand for redistribution, but rather two differentiated and stable equilibria: one in which a low rate of redistribution increases inequality of future incomes due to financial market imperfections and another in which a low level of inequality is reinforced through high redistribution.
The ideological approach argues that attitudes toward redistribution cannot be explained by self-interest, but by values and political orientations (Feldman and Zaller,
1992). At the aggregate level, different welfare regimes would be the consequence of the national political cultures. In a classic paper, Lane (1959) argued that preferences regarding redistribution are the consequence of the society’s dominant ideology. This argument would explain why we do not observe a much more aggressive demand for redistribution in capitalist societies. According to Lane, the dominant ideology inhibits demand for redistribution through the idea of meritocracy and by focusing on consumption. This ideology causes high intra-class competition for conspicuous consumption and reduces inter-class conflicts. In the end, the ideals of freedom and equality serve as a source of legitimacy for capitalist society, assuring domination by the bourgeois class.
Jacoby (1994) pointed out that individuals sustain coherent opinions toward public spending in social programs according to their preferences regarding freedom and equality.
The political debate about distributive policies is driven mainly by ideology, which causes a framing effect: while left-wing parties focus on the distributive impact of public spending, conservative parties focus on the negative impact of public spending on the economy. In a similar vein, Hetherington (2004) argues that basic political values, such as political trust, have a significant impact on individual preferences for redistribution. According to Hetherington (2004) people will be more willing to make sacrifices for society (such as paying taxes) when they have a great deal of trust in political institutions. Further, the influence of political values will be stronger in the case of preferences for redistributive policies than in other areas of public policy making.
Following these lines, a great deal of research has been done on the determinants of preferences for redistribution at the individual level during the last decade (Harms and Zink, 2003; Lübker, 2007). New approaches are mainly inspired by the self-interest tradition, but they attempt to combine elements of the ideological tradition as well. Three main avenues of research can be cited. First, some scholars have argued that cultural factors, such as the evaluation of inequality and meritocratic beliefs, shape preferences for redistribution. If people think they live in a meritocracy, in which inequalities are the outcome of one’s merit and effort, they may not want to vote for redistribution, because hard-working individuals should have the opportunity to climb in the social hierarchy by their own efforts. In the same vein, expectations of social mobility may induce the poor to believe they will have a higher income in the future and thus to vote against redistribution
(Alesina and La Ferrara, 2005; Benabou and Ok, 2001; Piketty, 1995). A somewhat different explanation of the relationship between preferences for redistribution and expectations relies on the notion of risk: individuals may want to vote for redistribution if they think they are at risk of poverty even if they are not poor right now (Moene and M.
Wallerstein, 2001, Iversen and Soskice, 2001).
Second, many studies have focused on the relationship between welfare state regimes (as well as other national variables) and the demand for redistribution at the individual level. According to the institutional approach, different welfare regimes are inspired by different principles of solidarity, giving rise to different attitudes to welfare among the population. The common hypothesis states that demand for redistribution will be higher in social democrat regimes than in liberal regimes, while conservative regimes should fall in between the other two (Arts and Gelissen, 2001; Jaeger, 2006). However, empirical evidence is still not conclusive about the regime hypothesis because attitudes toward different social policies seem to affect the demand for redistribution in different ways.
On the other hand, there is also evidence regarding the relationship between fiscal structures (the mix of direct and indirect taxation) and the demand for redistribution (Ganghof, 2006; Jaime-Castillo, 2008). Following Goughlin (1980), dependence on direct taxation may increase fiscal resistance and erode support for the welfare state. In the same vein, Hibbs and Madsen (1981) argued that the combination of highly “visible” direct taxation and a high level of public services is the combination most vulnerable to fiscal revolts and mobilizations against the welfare state. More recently, Wilensky (2002) and Kato (2003) pointed out that the path to the development of contemporary welfare states is based upon a mixture of regressive indirect taxes. Kato (2003) argues that the existence of indirect taxation guarantees the resources to finance social policies. This argument would explain why the more developed welfare states are those in which an indirect tax on consumption appeared (and became established) earlier. Therefore, high redistribution in social-democratic welfare states does not operate through the fiscal system. Regressive indirect taxation produces high fiscal revenue to finance public services and generous cash transfers, through which redistribution takes place. The main conclusion is that a widespread utilization of indirect taxes avoids fiscal resistance from wealthy groups.
In contrast, Ganghof (2006) argues that the causal relationship between fiscal structure and the welfare state operates in the opposite direction. According to Ganghof, governments must choose between different fiscal instruments to finance costly social policies, and taxing capital will have a negative impact on employment. This is the reason why social-democratic welfare states have relied on indirect taxation since the seventies.
Beramendi and Rueda (2007) highlight the fact that the choice of economic policies is not entirely free for governments, given the institutional constraints they face. In highly corporatist countries, the social pact is based upon the agreement between the government and the corporate actors. In this setting, unions guarantee wage moderation and social peace in exchange for generous welfare policies, and corporations guarantee economic growth in the long run in exchange for moderate taxation on capital.
Third, several studies using the self-interest approach have departed from the traditional analysis of individual preferences and have investigated how individual preferences are shaped by the social groups to which individuals are committed. These studies have been pioneered by the sociological literature about the relationship between preferences regarding redistribution and class (Svallfors, 1997). They were followed by different studies about the impact of ethnic and racial divisions (Alesina and Glaeser, 2004) and group loyalty (Luttmer, 2001). Alesina and Glaeser (2004) conclude that redistribution must be lower in highly fragmented societies because of groups’ resistance to distribution in favor of the other groups. For instance, racial divisions would explain why the USA does not have a welfare state. The notion of ‘group loyalty’ implies that individual support for welfare spending will increase as the share of recipients from the same group rises and vice versa (Luttmer, 2001). In a similar vein, Roemer and Van der Straeten (2006) argue that preferences for redistribution are negatively affected by xenophobia, as natives become reluctant to distribute if they believe redistribution will be in favor of immigrants. Some other studies have shown that support for redistributive policies is affected by the notion of deservingness (Van Oorschot, 2006). This means that the public makes important distinctions between support for redistributive spending that affects different groups. Over several decades in Western welfare states, ‘the public was found to be most in favor of social protection for old people, closely followed by protection for sick and disabled
people’ (Van Oorschot, 2006: 24), while giving less priority to public spending in favor of other groups, such as needy families or the unemployed.
All of these studies show that preferences for redistribution depend on how redistributive policies are implemented. This is why we must analyze ‘who gets what’ in the game of redistribution. However, the vast majority of empirical works analyze responses to the question asked in many surveys about whether the government should reduce differences in incomes. At the same time, only a few empirical works have addressed the issue of preferences for tax schemes (Edlund, 1999; 2000; Hansen, 1998;
Singhal, 2008). It is also important to note that there is a widespread opinion among social scientists that public opinion is misinformed and confused about taxes, although this is not always the case (Edlund, 2003).
Nevertheless, we argue that examining preferences regarding income equalization has some important shortcomings if we wish to study preferences regarding redistribution in a broad sense. First, this approach does not examine which groups will have to support taxation. It is already assumed that redistribution will take place from the wealthier to the poorer, but this is not always the case. Second, this approach does not give any information about the mechanisms through which redistribution will take place. It is not the same to reduce inequality through cash transfers in the short run and to equalize opportunities mainly through the educational system in the long run. The same individual may oppose one particular form of redistribution and be in favor of the other. Third, this approach does not take into account the many targeted redistributive policies and their redistributive effects. Contrary to common assumptions, redistribution does not have to go from the richer to the poorer, given that targeted policies benefit a particular social group and not a whole class of poor individuals. In a classic paper, Stigler (1970) proposes the existence of the Director’s Law, according to which redistribution runs from the poor and the rich to the middle classes. For these reasons, analysis of preferences for redistribution in a broad sense must consider how redistribution takes place. This should be done in a way that takes into account both preferences for specific spending policies and taxation schemes. While both elements are crucial to full understanding of preferences about redistribution, this paper focuses only on preferences for tax schemes.
3. Preferences for tax schemes. Some facts and hypothesis
A first look at the data about taxes and redistribution in a sample of European countries reveals striking differences in the configuration of public sectors across Europe, as shown by the data in table 1. We see a pattern of low inequality, accompanied by high social spending and high taxation, which is typical of the social-democrat welfare regimes.
We also see an opposite pattern of high inequality, accompanied by low social spending and low taxation, which is most typical in the United Kingdom, and some countries of southern and eastern Europe. As expected, there is a strong correlation between total taxation and social spending in the sample (0.738). However, the relationship between inequality, and both taxation and social spending is somewhat unclear. Inequality is highly correlated with total taxation (-0.659), while the correlation between inequality and social spending is weaker in the sample (-0.420). However, contrary to the argument of Wilensky (2002) and Kato (2003), the correlation between inequality and direct taxation is stronger than that between inequality and indirect taxation. That suggests that redistribution takes place mostly through the fiscal system in our sample, although we are not taking into account the differences between market pre-tax inequality and post-tax inequality.
Table 1: Income inequality, taxes and social expenditure by country
Gini index Total taxes (% GDP)
Indirect taxes (% GDP)
Direct taxes (% GDP)
Social expenditure (% GDP) Czech Republic 0.27 37.50 11.70 9.10 19.50
Denmark 0.23 50.70 16.30 31.10 27.08 Finland 0.27 43.90 13.80 16.80 26.10 France 0.28 43.90 11.10 10.30 29.17 Germany 0.30 34.80 10.10 9.80 26.75 Hungary 0.29 37.20 14.80 8.80 22.54 Ireland 0.33 30.60 11.60 11.70 16.73 Netherlands 0.27 38.80 12.30 10.80 20.88 Norway 0.28 43.50 12.10 21.40 21.64 Poland 0.37 32.90 12.60 6.40 21.03 Portugal 0.42 34.70 13.90 8.20 23.10 Spain 0.32 35.80 10.00 10.60 21.24 Sweden 0.23 49.50 12.90 19.40 29.43 Switzerland 0.28 29.20 6.90 13.00 20.26
United Kingdom 0.34 36.30 11.00 13.90 21.29
Notes: Indirect taxes include taxes on goods and services. Direct taxes include taxes on benefits and wages. Collected data for taxes and social expenditure are for the year 2005. The Gini index refers to 2004.
Source: OECD Database.
An important question is why different countries chose different fiscal systems and what role public preferences play in shaping fiscal systems. From the above review of the literature, it is clear that it is difficult to measure preferences for fiscal schemes at the individual level. To overcome this difficulty, Singhal (2008) uses data from the International Social Survey Program (ISSP) Role of Government III (1996) in which individuals were asked to indicate how much should be paid in taxes by individuals earning different incomes (the average wage, twice the average, four times and eight times the average wage). Singhal computes a measure of progressivity for each individual according to his responses to these questions and then compares average preferred progressivity with actual progressivity of fiscal systems in a sample of countries. In the same vein, Edlund (2003) uses Swedish data about the legitimate tax level for three income groups to compute a ‘legitimate tax progression index’. But he also compares these data with responses to an abstract question about progressivity of the fiscal system. In previous works, Edlund (1999;
2000) also used evaluations of fiscal fairness as the dependent variable to study fiscal preferences.
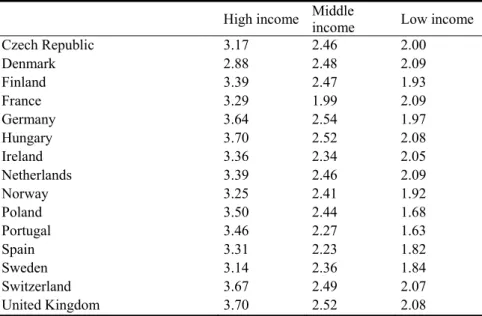
In this paper, we wish to concentrate on the redistributive effects of taxes by group rather than proposing a general measure of desired progressivity or evaluating the perceived fairness of the fiscal system as a whole. In different waves of the ISSP Role of Government, respondents were asked to express their opinion about the amount of tax (considering all taxes together, including wage deductions, income tax, taxes on goods and services and all other taxes) paid by different income groups: high, middle and low. Since no definition of high, middle and low income was given, each individual relied on his subjective definition of these three categories. The response scale ranges from 1 (much too high) to 5 (much too low). Data from the last wave of the ISSP (2006) by country are tabulated in Table 2. According to the scale, a higher value indicates that taxes for this particular group are viewed as too low on average. Data show that the majority of the public in many countries think that taxes paid by high income groups are too low and taxes paid by low income groups are too high. The perception of taxes paid by middle income groups falls somewhere in between. This suggests a demand for higher progressivity of the fiscal system in every country under study. However, differences by country are also
important, revealing different preferences about how to distribute (ideally) the fiscal burden. Particularly important is the difference between the evaluation of taxes paid by low and middle income groups. In France (but also in some non-European countries not mentioned here, like New Zealand), the average citizen thinks that the fiscal system treats middle income groups worse than it does low income groups.
Table 2: Country average of attitudes toward taxes paid by different income groups
High income Middle income Low income Czech Republic 3.17 2.46 2.00
Denmark 2.88 2.48 2.09 Finland 3.39 2.47 1.93 France 3.29 1.99 2.09 Germany 3.64 2.54 1.97 Hungary 3.70 2.52 2.08 Ireland 3.36 2.34 2.05 Netherlands 3.39 2.46 2.09 Norway 3.25 2.41 1.92 Poland 3.50 2.44 1.68 Portugal 3.46 2.27 1.63
Spain 3.31 2.23 1.82
Sweden 3.14 2.36 1.84 Switzerland 3.67 2.49 2.07 United Kingdom 3.70 2.52 2.08
Notes: Cells reflect average attitudes toward taxes paid by different income groups by country over a five- point scale, where 1 means “much too high” and 5 means “much too low”.
Source: ISSP Role of Government (2006).
While the data in Table 2 reflect the average acceptance of taxes in a particular society, the differences in the evaluation of taxes paid by different income groups reflect the distributive conflicts in that society. This is the main focus of our research. We can thus can think of the evaluation of taxes by group as a normative criterion for allocating taxes to different groups, as compared with the status quo, where the status quo represents the amount of taxes actually paid by each group. For instance, we can think that those who believe that taxes are too low for rich and middle income groups and too high for low income groups are in favor of redistributing to the low income group.
Before explaining our hypothesis, we must define a metric to measure the group to which one particular individual wants to redistribute. For this purpose, let us assume that
society is divided into three income groups: low (l), middle (m) and high (h). Total taxes paid by group j are denoted by tj, which includes wage deductions, income tax, taxes on goods and services and all other taxes. A change in taxes paid by group j is denoted by Tj. Hence, Tj may be either positive (meaning an increase in the taxes paid by group j) or negative (meaning a decrease in the taxes paid by group j). Let us now suppose that citizens must vote over the policy space vector T = {Tl, Tm, Th}. The 3-tuple choice made by typical voter i can be described by any of the following nine orderings: (1) Tli = Tmi = Thi; (2) Tli <
Tmi < Thi; (3) Tli < Tmi = Thi; (4) Tli = Tmi < Thi; (5) Tli > Tmi < Thi; (6) Tli > Tmi > Thi; (7) Tli = Tmi > Thi; (8) Tli > Tmi = Thi; and (9) Tli < Tmi > Thi.
The set of nine orderings fully describes preferences regarding the distribution of taxes across income groups, since we are not interested in the value of Thi itself. It is important to understand that the redistributive effects of each 3-tuple in the set is the ordering of preferred changes by group. We will use this set of orderings to define our measure of ‘preferences for targeted distribution through taxation’ (TDT). Ordering (1) reflects the preference for the status quo, since no group will be better off in the redistribution game. This does not mean the same tax level. Under ordering (1), taxes may be increased or decreased for all three groups at the same time, but none is privileged. We will call this ordering ‘pro status quo’ preference. Orderings (2) and (3) reflect a preference for increasing the welfare of the low income group, which we therefore call ‘pro poor’
preference. Ordering (5) will be called ‘pro middle class’ preference. Orderings (6) and (7) will be called ‘pro rich’ preference.
Orderings (4), (8) and (9) are somewhat different from the rest, since each contains two groups that gain from the change at the expense of the other group. First, consider orderings (4) and (8). Ordering (4) reflects a preference for low and middle income groups over the high income group, while ordering (8) reflects a preference for middle and high income groups. Both orderings include the middle income group as a pivotal point.
However, because of the direction of the differences we have decided to include ordering (4) in the ‘pro poor’ preference and ordering (8) in the ‘pro rich’ preference. While this decision may obscure some important differences between orderings, we must make this decision in order to simplify our metric and to allow for empirical tractability. On the other hand, ordering (9) is not linear, since the two winner groups are at the extremes of the
income ladder, while the middle class has to pay an increase in taxes. Since this ordering cannot be subsumed under any of the previous categories, however, we have decided to call this ordering ‘pro-extremes’ preference. Taking all things together, we can now write our TDT metric using a set of conditional expressions that covers the whole preference space.
The following five preferences are considered:
(1) Status quo: iff Tli = Tmi = Thi
(2) Pro poor: iff Tli ≤ Tmi and Tli < Thi
(3) Pro middle class: iff Tli > Tmi and Tmi < Thi
(4) Pro rich: iff Tli > Thi and Tmi ≥ Thi
(5) Pro extremes: iff Tli < Tmi and Tmi > Thi
Preference (1) is that of the voters who are in favor of the status quo; preference (2) is that of the voters who want to redistribute to the poor; preference (3) is that of the voters who want to redistribute to the middle class from the extremes of the income ladder;
preference (4) is that of the voters who want to redistribute to the rich; and preference (5) is that of the voters who want to redistribute from the middle class to the extremes of the income ladder. Using this metric we have defined some hypotheses concerning the distribution of preferences among the population at the individual level:
Hypothesis 1.1: According to the self-interest approach, redistributive preferences will be linked to socio-economic status at the individual level. As socio-economic status increases, pro poor preferences will decrease and pro middle class and pro rich preferences will increase.
Hypothesis 1.2: According to the self-interest approach, redistributive preferences will depend on position in the labor market at the individual level. Unemployment, low education and other disadvantages in the labor market will affect positively pro poor preferences and negatively pro middle class and pro rich preferences.
Hypothesis 1.3: According to the ideological approach, redistributive preferences will be linked to ideology at the individual level. As we move from the left to the
right of the ideological spectrum, pro poor preferences will decrease and pro middle class and pro rich preferences will increase.
Hypothesis 1.4: According to the ideological approach, redistributive preferences will correlate with political orientations. Union membership will affect pro poor preferences positively and pro middle class and pro rich preferences negatively.
We consider some additional hypotheses at the national level:
Hypothesis 2.1: According to the literature about altruism, inequality will affect preferences for redistribution at the national level. As inequality increases, pro poor preferences will increase and pro middle class and pro rich preferences will decrease.
Hypothesis 2.2: Given the redistributive effect of taxes, taxation will affect preferences for redistribution at the national level. As the amount of taxes increases, pro poor preferences will decrease and pro middle class and pro rich preferences will increase. This relationship will be more intense in the case of direct taxation.
4. Data and methods
Data and variables
Two different sources of data have been used. Attitudinal variables are taken from the International Social Survey Program (ISSP): “Role of Government” (2006). Data on income inequality and taxes are taken from the OECD Database. In the 2006 wave of the ISSP, respondents were asked about their opinion regarding the amount of taxes paid by different income groups: “Generally, how would you describe taxes in [R’s Country]
today? (We mean all taxes together, including [wage deductions], [income tax], [taxes on goods and services] and all the rest.). First, for those with high incomes, are taxes ... Next, for those with middle incomes, are taxes... Lastly, for those with low incomes, are taxes ...”.
The ordered categorical responses for the three items were: (1) “much too high”, (2) “too high”, (3) “about right”, (4) “too low”, and (5) “much too low”.
Using these three items, we created a dependent categorical variable. According to notation introduced in the previous section, let Tli denote the attitude of individual i toward the taxes paid by low income people, Tmi the attitude toward the taxes paid by middle income people, and Thi the attitude toward the taxes paid by high income people. Formally, the dependent variable takes value 0 (status quo preference) for a particular individual when Tli = Tmi = Thi, irrespective of the value of any of the three variables. It takes value 1 (pro poor preference) when Tli ≤ Tmi and Tli < Thi. It takes value 2 (pro middle class preference) when Tli > Tmi and Tmi < Thi. And it takes value 3 (pro rich preference) when Tli
> Thi and Tmi ≥ Thi1. Those who prefer the status quo are those who think that no group is better or worse off than any other with respect to the tax burden. Those who have pro poor preferences are those who think that the poor and the middle classes pay too much in taxes as compared to the rich. Pro middle class preferences imply that the middle class pays too much in taxes as compared to both the rich and the poor. And pro rich preferences mean that the rich pay too much in taxes as compared to the other two groups.
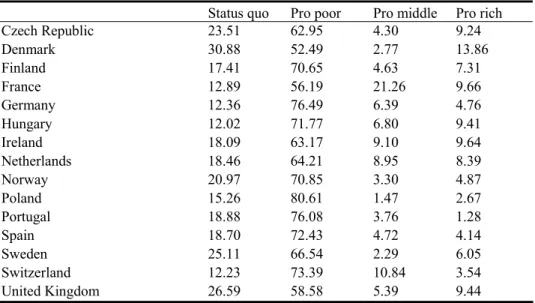
Table 3: Preferences for targeted redistribution through taxation by country
Status quo Pro poor Pro middle Pro rich Czech Republic 23.51 62.95 4.30 9.24
Denmark 30.88 52.49 2.77 13.86 Finland 17.41 70.65 4.63 7.31 France 12.89 56.19 21.26 9.66 Germany 12.36 76.49 6.39 4.76 Hungary 12.02 71.77 6.80 9.41 Ireland 18.09 63.17 9.10 9.64 Netherlands 18.46 64.21 8.95 8.39 Norway 20.97 70.85 3.30 4.87 Poland 15.26 80.61 1.47 2.67 Portugal 18.88 76.08 3.76 1.28 Spain 18.70 72.43 4.72 4.14 Sweden 25.11 66.54 2.29 6.05 Switzerland 12.23 73.39 10.84 3.54 United Kingdom 26.59 58.58 5.39 9.44
Source: ISSP Role of Government (2006).
1 As has already been discussed, there is another possibility in which Tli < Tmi and Tmi > Thi. Those having this order of preference will want to redistribute from the middle to both extremes. Only a few cases in the whole database fall into this category and none of them appears in the estimation sample. They have been omitted from the analysis for this reason.
A cross-tabulation of the dependent variable by country is reported in Table 3. The data reflect striking differences across countries. Although the most numerous group in all of the countries is the ‘pro poor’ cluster, the highest proportion of ‘pro status quo’ are found in the social-democratic welfare regimes, with the exception of Norway. Also significant is the comparatively high proportion of ‘pro middle class’ in France, but also in Switzerland, Ireland and the Netherlands. Finally, the proportion of the ‘pro rich’ group is comparatively high in Denmark, but also in France, Ireland, Hungary and the Czech Republic.
Two types of explanatory variables are included in the analysis: individual attributes and national variables. Individual attributes include ideological preferences and socio- economic variables. Ideology reflects the individual’s political preferences. In the ISSP database, the way ideology is computed varies across countries. For most of the countries, ideology is derived from the party to which an individual feels closest. In some other countries, however, ideology is computed as self-placement on a seven point scale (1 =
“Far left, etc.”, 2 “Left, center left”, 3 “Center, liberal”, 4 “Right, conservative”, 5 “Far right, etc.”, 6 “Other, no specification”, and 7 “No party preference”). In order to have a continuous scale, only values from 1 to 5 are taken. Socio-demographic variables include those that reflect differences in sources of income according to the literature on labor markets and inequality. Yet these variables have been proven to correlate with preferences for redistribution in many different studies across countries (Alesina and La Ferrara, 2005).
This group of variables includes: gender (0 = “Male”, and 1 = “Female”), age and age squared, education level2 (0 = “No formal education”, 1 = “Primary School”, 2 =
“Secondary School”, and 3 = “University”), ISEI scores for socio-economic status, work status3 (1 = “Employed”, 2 = “Unemployed”, and 3 = “Not in the labor force”), and self- employed (0 = “No” and 1 = “Yes”). Two additional variables have been included: whether the person works in the private or the public sector (0 = “Private sector” and 1 = “Public
2 This variable has been recoded from original values. No formal education category includes those who have no education and those who have not finished primary education. Likewise, those who have not completed an educational level have been assigned to the highest level that they have completed.
3 This variable has been recoded from original values. The category “employed” includes full-time and part- time workers. The category “not in the labor force” includes those who are helping a family member, students, retired people, housewives or housemen, the permanently disabled and others not in the labor force.
sector”), and trade union membership at the present time (0 = “Not member” and 1 =
“Member”). Income has not been taken into account as an explanatory variable since income data in the ISSP are not standardized and we cannot compare across countries.
Socio-economic status is measured through the International Socio-Economic Index of Occupational Status (ISEI) scores proposed by Ganzeboom and Treiman (1996). The ISEI is conceived as measuring the characteristics of occupations that translate a person’s education into income. The index is computed using a causal model that links occupational status, education and income, controlling for age. Estimated coefficients are then used as weights to compute scores for each occupation in the ISCO88 classification.4 The purpose of this procedure is to assign scores to each occupation by the ‘optimal scaling of occupational unit groups to maximize the indirect effect of education on income through occupation and to minimize the direct effect of education on income, net effect of occupation (with both effects net of age)’ (Ganzeboom and Treiman, 1996: 212).
Table 4: Descriptive Statistics
Variable Mean Std. Dev. Min. Max.
Gender 1.518 0.500 1 2
Age 48.478 16.916 15 98
Age Squared 2636.198 1703.397 225 9604 Education level 1.598 0.802 0 3
ISEI 43.765 16.739 16 90 Work Status 1.812 0.959 1 3
Self-employed 0.124 0.330 0 1 Public worker 0.329 0.470 0 1
Union member 0.256 0.436 0 1
Ideology 2.836 1.055 1 5 Gini index 0.300 0.049 0.232 0.416
Total taxation (as percentage of GDP) 38.802 6.095 29.200 50.700 Indirect taxation (as percentage of GDP) 12.014 2.126 6.900 16.300 Direct taxation (as percentage of GDP) 13.324 6.343 6.400 31.100
Source: ISSP Role of Government (2006).
National variables include inequality of income, indirect taxation and direct taxation. Inequality is measured through the Gini index. The index is computed for equivalised disposable income among persons, using the OECD modified scale. Indirect
4 Scores for each occupation in the ISCO88 classification are available in Ganzeboom and Treiman (1996), Appendix A. These scores are widely used to measure socio-economic status in Sociology.
taxation is the sum of taxes on goods and services as a percentage of the GDP. Direct taxation is the sum of taxes on benefits and wages as a percentage of the GDP (it does not include Social Security contributions). A relationship between inequality and preferences for redistribution is proposed in many theoretical models, and we should expect that preferences for tax schemes will be affected by the fiscal burden. At the same time, the fiscal structure (the balance between direct and indirect taxation) may affect preferences for redistribution (Jaime-Castillo, 2008). A descriptive analysis of the variables included in the analysis is provided in Table 4. Given the data available at the individual and the national level, the following countries have been included in the analysis: Czech Republic, Denmark, Finland, France, Germany, Hungary, Ireland, the Netherlands, Norway, Poland, Portugal, Spain, Sweden, Switzerland, and the United Kingdom. The list includes a good representation of different welfare regimes and fiscal structures in Europe.
Statistical methodology
Given that the dependent variable is multi-categorical, multinomial logistic regression has been used to estimate the effect of explanatory variables. However, as previously argued, individuals are nested within countries, so multilevel procedures must be used to estimate logistic regression coefficients (Goldstein, 2003; Rabe-Hesketh, Skrondal and Pickles, 2005; Raudenbush and Bryk, 2002). For a multinomial variable, with M categories, we have M-1 equations at the individual level, as follows:
1 0
1 1
log 1
Q mij
mij M mj qmj qij mij
q mij
m
X
(1)where in our model there are M=4 categories of response, mij represents the odds ratio of category m for individual i within group j, which is a function of the Q individual
level predictors Xqij. qmj denotes the effect of predictor q on the odds ratio of category m, and mij denotes the error term for category m in individual i within group j.
As individuals are nested within groups (countries in that case), qmj may vary across groups. Thus, we can rewrite coefficient qmj as a function of an error term Uqmj (the random effect) and S national level predictors Zsj. Therefore, qmj can be written as:
0
1 S
qmj qm qsm sj qmj
s
Z U
(2)The full model thus includes both fixed and random effects. We assume in our model that the effect for each individual and national variable is fixed across countries, but there is a random effect accounting for variance of responses across countries. This implies that errors are constant within countries but not between countries. At the same time, we assume that errors do not correlate across responses and countries. Taking Equations (1) and (2) together and rearranging the right-hand term, we can write our full model M-1 equations as:
00 0 0 0
1 1 1
1
log 1
Q S
mij
mij M m qm qij sm sj mj mij
q s
mij m
X Z U
(3)Maximum-likelihood (ML) estimation of multilevel models with categorical outcomes involves significant computational problems due to multidimensional numerical integration, given the high dimensionality of the likelihood function. There are two main approaches in the literature to deal with this issue: the quasi-likelihood methods (PQL and MQL) and the approximation of the likelihood function by some numerical method of integration. While quasi-likelihood methods are less computationally demanding, they do
not directly involve likelihood, as they use a linear Taylor expansion of the inverse link function around current estimates of fixed and random effects. At the same time, QL estimates are negatively biased if large variance components are present or if the distribution of the response variable departs from normality (as is the case in our model). In this case, we have used the Adaptive Gaussian Quadrature approximation of the maximum likelihood, as proposed by Rabe-Hesketh, Skrondal and Pickles (2005), which scales and translates the quadrature points taking into account the properties of the integrand. The Newton-Raphson algorithm was subsequently used to maximize the likelihood function.
Calculations have been done using the GLAMM routine.
5. Findings and discussion
Estimates of our model are reported in Table 5. The table includes three columns, one for each equation (pro poor, pro middle class and pro rich). Preference for the status quo has been taken as the base outcome. The table is divided into two sections: the fixed part of the model and the random part. Within the fixed part, we also distinguish between individual and national variables. After running the model, we focused on some specific effects of socio-economic status and ideology to show in more detail how these variables affect preferences for targeted redistribution through taxation. To do this, we simulate probabilities for each category of the dependent variable using estimates from our model. In order to simulate probabilities through the variables of interest, the rest of the variables are taken at the average national value. Predicted probabilities by country are reported in Figures 1 and 2. The base outcome (pro status quo preference) is omitted from the graphs for easier inspection. Figure 1 presents probabilities for each preference relative to ISEI scores, and Figure 2 presents probabilities against ideology.
Table 5: Preferences for targeted redistribution through taxation in European countries. Multilevel Multinomial Logistic Regression
Equation 1 (pro poor)
Equation 2 (pro middle)
Equation 3 (pro rich) Fixed Part
Individual Variables
Female 0.078 -0.025 0.032
(0.055) (0.096) (0.092)
Age 0.034*** 0.060*** -0.023
(0.011) (0.020) (0.018)
Age Squared -0.001* -0.001** <0.001
(<0.001) (<0.001) (<0.001) Primary Education 0.324* 0.002 -0.594*
(0.165) (0.320) (0.304)
Secondary Education 0.309* 0.075 -0.145
(0.173) (0.330) (0.309)
University 0.084 -0.050 0.009
(0.184) (0.348) (0.323)
ISEI -0.014*** 0.004 0.006*
(0.002) (0.003) (0.003)
Unemployed 0.433*** -0.866** 0.127
(0.157) (0.386) (0.273)
Not in the labor force 0.154* -0.204 0.044
(0.082) (0.151) (0.138)
Self-employed -0.260*** -0.191 0.044
(0.082) (0.144) (0.130)
Public worker 0.102 0.123 -0.324***
(0.064) (0.111) (0.109)
Union member 0.258*** -0.023 -0.080
(0.071) (0.128) (0.117)
Ideology -0.278*** -0.066 0.193***
(0.026) (0.046) (0.044)
Constant 1.971** 1.954* 0.973
(0.767) (1.040) (1.006)
National Variables
Gini index 1.187 -7.007*** -7.526***
(1.763) (2.148) (2.158) Indirect taxation -0.062* -0.097** 0.073*
(as percentage of GDP) (0.038) (0.043) (0.044) Direct taxation -0.032** -0.099*** -0.044***
(as percentage of GDP) (0.014) (0.018) (0.016) Random Part
Level 2 Variance (U0j) 0.076 0.076 0.076 (0.027) (0.027) (0.027) No. Obs. Level 1 10062 10062 10062 No. Obs. Level 2 15 15 15 Notes: ***, **, and * indicate significance level at 1%, 5%, and 10%, respectively. Standard errors appear in brackets.
“Status quo” is the reference category.
Source: ISSP Role of Government (2006).
As shown in Table 5, the hypothesis about the impact of socio-economic status on preferences (Hypothesis 1.1) is confirmed by the data. It has a negative and highly significant impact on preferences for redistribution toward the poor and a positive effect on preferences for redistribution toward the rich and the middle class. However, the hypothesis is not significant in the case of the middle class. As shown in Figure 1, the variability of preferences by ISEI scores in our sample of countries is high, especially in the case of pro poor preferences.
Figure 1: Simulated preferences for redistribution by ISEI for each country
0.510.510.510.51
20 40 60 80 100
20 40 60 80 100 20 40 60 80 100 20 40 60 80 100
cz-czech republic dk-denmark fi-finland fr-france
de-germany hu-hungary ie-ireland nl-netherlands
no-norway pl-poland pt-portugal es-spain
se-sweden ch-switzerland gb-great britain
Pr(pro poor) Pr(pro middle) Pr(pro rich)
Probabilities
ISEI
Notes: Probabilities for each category of the dependent variable have been simulated using estimates from the model reported in Table 5. Base outcome (pro status quo preference) is omitted.
Source: ISSP Role of Government (2006).
The hypothesis about the impact of education and labor market disadvantages on preferences (Hypothesis 1.2) is partially confirmed. Primary and secondary education has a
positive impact on redistribution to the poor, and primary education has a negative impact on redistribution to the rich. Other effects are not significant. Being unemployed increases the probability of being in favor of redistribution toward the poor and opposing redistribution toward the middle class. At the same time, being out of the labor market increases the probability of demanding redistribution toward the poor. People who are self- employed oppose redistribution toward the poor, and public workers will oppose redistribution toward the rich. While other effects are not significant, these results are in line with previous research on preferences for redistribution in a broad sense.
Other socio-demographic variables included in the model, such as gender and age, have mixed effects. While there are no differences by gender, the relationship between age and pro poor and pro middle class preference show an inverted U-shaped curve, since the effect of age is positive and the effect of age squared is negative. This means that support for redistribution to the poor is greatest during middle age. Those who are youngest and oldest are less prone to redistribute in favor of the poor or the middle classes. Pro rich preferences do not seem to be affected by age.
The hypothesis about the impact of ideology on preferences (Hypothesis 1.3) has been clearly confirmed by the data. As shown in Figure 2, the variability of preferences by ideology in our sample of countries is high, especially in the case of pro poor preferences.
On the other hand, the hypothesis about the impact of union membership on preferences (Hypothesis 1.4) is partially confirmed. It increases the probability of being in favor of redistribution to the poor, and its sign is negative for redistribution to the middle class and the rich. However, it is not significant in the last two cases.
Figure 2: Simulated preferences for redistribution by ideology for each country
0.510.510.510.51
1 2 3 4 5
1 2 3 4 5 1 2 3 4 5 1 2 3 4 5
cz-czech republic dk-denmark fi-finland fr-france
de-germany hu-hungary ie-ireland nl-netherlands
no-norway pl-poland pt-portugal es-spain
se-sweden ch-switzerland gb-great britain
Pr(pro poor) Pr(pro middle) Pr(pro rich)
Probabilities
Ideology (1-5)
Notes: Probabilities for each category of the dependent variable have been simulated using estimates from the model reported in Table 5. Base outcome (pro status quo preference) is omitted.
Source: ISSP Role of Government (2006).
National variables included in the model also have a significant impact on preferences for redistribution. The direction of the influence is mainly in line with our hypotheses, although some important qualifications must be considered. As we predicted (Hypothesis 2.1), preferences for redistribution to the middle class and the rich decrease as inequality increases. The effect of inequality on preferences for redistribution toward the poor is positive, though far from significant. That implies a certain degree of inequity aversion among the European public. Those living in highly unequal countries are less in favor of decreasing taxes for the middle class and the rich, even though there is no evidence that they want to decrease taxes for the poor.
Fiscal policy also has an impact on preferences for redistribution. Both indirect and direct taxation, as a percentage of the GDP, have a significant effect on all three
preferences. Contrary to what we expected (Hypothesis 2.2), preferences for redistribution toward the poor, the middle class and the rich are negatively correlated with the fiscal burden, and indirect taxation has a positive impact on pro rich preferences. Our results suggest that, contrary to common wisdom, as the fiscal burden increases, redistributive conflicts over taxes tend to decrease. The positive correlation between the tax burden and pro status quo preferences also suggests that, in such cases, fiscal resistance increases across all groups. On the other hand, the positive effect of indirect taxation on pro rich preferences is difficult to explain. It implies that resistance to taxing the rich will increase as indirect taxes increase, even though indirect taxation is supposed to have regressive effects.
Finally, no clear pattern emerges concerning the differences between indirect and direct taxation. Contrary to what we expected, indirect taxation has a stronger effect on pro poor preferences. The effects are almost the same for pro middle class preferences, and the effects take the opposite sign for pro rich preferences. We have thus not found any support for the higher visibility of the direct taxation hypothesis. Our results suggest again that a high tax burden does not exacerbate redistributive conflicts over taxes. Furthermore, this conclusion does not seem to be affected by the way taxes are collected (through indirect or direct taxation). These results seem to be highly robust to different specifications. To prove that, we have estimated an alternative model in which we include Social Security contributions in the direct taxation burden, but the overall results remain unchanged.
6. Conclusions
Empirical analysis of preferences regarding redistribution has traditionally been based on questions about preferences regarding equalization of income at a highly abstract level. However, this approach is somewhat limited when we seek to understand fully preferences for targeted redistribution. We have argued that we need to know preferences about fiscal schemes and social policies. In this paper, we have concentrated on preferences regarding targeted redistribution through taxation. After defining a metric for preferences, we have tested empirically several hypotheses about the distribution of the preferences among the public in a sample of European countries using a multilevel approach.
Our estimates offer mixed support for self-interest and ideological approaches.
While socio-economic status and labor market variables are good predictors of pro poor preferences, such preferences correlate with ideology as well. As we expected, the effect of each variable tends to be the opposite for pro poor and pro rich preferences. However, a pro middle class preference is more difficult to understand. Its determinants are somewhat similar to those of the pro rich preferences, but there is not a clear pattern of social groups having pro middle class preferences. However, national variables do affect individual preferences to some extent in the direction our hypothesis predicted.
Moreover, our results suggest that preferences for tax schemes are coherent across individuals, as they reflect the influence of variables that have been proven to have an effect on preferences for redistribution in the predicted direction. Furthermore, our results open new questions to be addressed in future research. First, some comparative issues appear. Our sample of European countries includes an important variety of fiscal systems and welfare regimes, so we can establish some important international comparisons.
However, it is important to know whether these results remain valid in contexts outside Europe. Second, pro middle class preferences remain somewhat unclear in our analysis. As the middle class falls in intermediate categories of socio-economic status, it is difficult to capture the linear impact of these variables on pro middle class preferences. At the same time, some new metrics of preferences may be explored in order to explain how possible distributional coalitions may arise.
Finally, it is very important to understand how preferences for taxes are related to preferences for public spending. We may assume that an individual in favor of redistribution toward one particular group through taxation will be in favor of redistribution toward the same group through spending. However, this conclusion has not proven to be the case under all circumstances. For instance, some popular discourses in the political arena propose a reduction of the tax burden on the middle class but still defend public spending targeted to low income groups. Nevertheless, it seems to be quite difficult to construct such a measure of redistributive preferences (taking into account preferences for both tax schemes and spending) using the available survey data.
References
Alesina, A. F. and Glaeser, E. L. (2004). Fighting poverty in the US and Europe: A world of difference. Oxford: Oxford University Press.
Alesina, A., and E. La Ferrara (2005). Preferences for redistribution in the land of opportunities. Journal of Public Economics, 89(5-6): 897-931.
Arts, W. and J. Gelissen (2001). “Welfare states, solidarity and justice principles: Does the type really matter?” Acta Sociologica, 44(4), 283-299.
Benabou, R. (2000). Unequal societies: Income distribution and the social contract.
American Economic Review, 90(1): 96-129.
Benabou, R. and E. A. Ok (2001). “Social Mobility and the Demand for Redistribution:
The POUM Hypothesis”, Quarterly Journal of Economics, 116(2): pp. 447-487.
Benabou, R. and J. Tirole (2006). “Belief in a Just World and Redistributive Politics”, Quarterly Journal of Economics, 121: 699-746.
Beramendi, P. and D. Rueda (2007). “Social Democracy Constrained: Indirect Taxation in Industrialized Democracies”, British Journal of Political Science, 37: 619-641.
Coughlin, R. M. (1980). Ideology, Public Opinion and Welfare Policy. Berkeley: Institute of International Studies.
Edlund, J. (1999). “Attitudes towards Tax Reform and Progressive Taxation: Sweden 1991- 1996”, Acta Sociologica, 42(4): 337-355.
Edlund, J. (2000). “Public Attitudes towards Taxation: Sweden 1981-1997”, Scandinavian Political Studies, 23(1): 37-65.
Edlund, J. (2003). “Attitudes toward Taxation: Ignorant and Incoherent?”, Scandinavian Political Studies, 26(2): 145-167.
Feldman, S. and J. Zaller (1992). “The Political Culture of Ambivalence: Ideological Responses to the Welfare State”, American Journal of Political Science, 36(1): pp.
268-307.
Ganghof, S. (2006). “Tax Mixes and the Size of the Welfare State: Causal Mechanisms and Policy Implications”, Journal of European Social Policy, 16(4): 360-373.
Ganzeboom, H. B. and D. J. Treiman (1996). “Internationally Comparable Measures of Occupational Status for the 1988 International Standard Classification of Occupations”, Social Sciences Research, 25: 201-235.
Goldstein, H. (2003). Multilevel Statistical Models. London: Arnold.
Hansen, J. M. (1998). “Individuals, Institutions, and Public Preferences over Public Finance”, American Political Science Review, 92(3): 513-531.
Harms, P. and S. Zink (2003). “Limits to Redistribution in a Democracy: A Survey”, European Journal of Political Economy, 19: 651-668.
Hetherington, M. J. (2004). Why Trust Matters: Declining Political Trust and the Demise of American Liberalism. Princeton: Princeton University Press.
Hibbs, D. A. and H. J. Madsen (1981). “Public Reactions to the Growth of Taxation and Government Expenditure”, World Politics, 33: 413-435.
International Social Survey Programme (2006). Role of Government (ISSP 2006).
Iversen, T., and D. Soskice (2001). An asset theory of social policy preferences. American Political Science Review, 95(4), 875-893.
Jacoby, W. G. (1994). “Public Attitudes toward Government Spending”, American Journal of Political Science, 38(2): pp. 336-361.
Jaeger, M. M. (2006). “Welfare Regimes and Attitudes toward Redistribution: The Regime Hypothesis Revisited”, European Sociological Review, 22(2): pp. 157-170.
Jaime-Castillo, A. M. (2008). “Préférences pour la Redistribution en Europe: Inégalité Sociale, État-Providence et Dispositions Fiscales”, Pôle Sud, 28: 109-141.
Kato, J. (2003). Regressive Taxation and the Welfare State. Path Dependence and Policy Diffusion. Cambridge: Cambridge University Press.
Lane, R. E. (1959). “The Fear of Equality”, American Political Science Review, 53: pp. 35- 51.
Lübker, M. (2007). Inequality and the demand for redistribution: are the assumptions of the new growth theory valid? Socio-Economic Review, 5(1): 117-148.
Luttmer, E. P. (2001). “Group Loyalty and the Taste for Redistribution”, Journal of Political Economy, 109 (3): 500-528.
Meltzer, A. H. and S. F. Richard (1981). “A Rational Theory of the Size of Government”, Journal of Political Economy, 89(5): 914-927.