KNOWLEDGE CREATION AND KNOWLEDGE LINKAGES IN THE US REGIONS
MALGORZATA RUNIEWICZ-WARDYN JESUS LÓPEZ-RODRIGUEZ
FUNDACIÓN DE LAS CAJAS DE AHORROS DOCUMENTO DE TRABAJO
Nº 724/2013
De conformidad con la base quinta de la convocatoria del Programa de Estímulo a la Investigación, este trabajo ha sido sometido a eva- luación externa anónima de especialistas cualificados a fin de con- trastar su nivel técnico.
ISSN: 1988-8767
La serie DOCUMENTOS DE TRABAJO incluye avances y resultados de investigaciones dentro de los pro- gramas de la Fundación de las Cajas de Ahorros.
Las opiniones son responsabilidad de los autores.
KNOWLEDGE CREATION AND KNOWLEDGE LINKAGES IN THE US REGIONS
Malgorzata Runiewicz-Wardyn*
Jesus López-Rodriguez**
Abstract
The degree of innovation dynamics of territories depends on their capacity to absorb, transfer and create knowledge. This paper investigates the underlying conditions for knowledge creation in the US regions. Adopting Griliches’ (1979) and Jaffe’s (1989) methodology, this paper presents the results of the estimation of a simultaneous equation model which draws on Griliches (1979) knowledge production function to test the efficiency of the inter-linkages between university and industry in the US regions. The results suggest that the knowledge creation process across US regions depends significantly on a highly qualified labour force, employment in high-tech industries, the geographical concentration of the manufacturing industry and positive university-industry R&D interaction. The results further suggest that government R&D funding can crowd out private industry investment in R&D.
Keywords: Knowledge production, R&D, university-industry linkages, US.
JEL Codes: 030, 038, 033, R10.
Corresponding author: *TIGER Research Centre, Koźminski University, Jagiellońska 59, Warsaw 03-301.Phone: +48 56 475 61 12; email: [email protected].
**Institute for Prospective Technological Studies (IPTS-JRC), European Commission DG Joint Research Centre, E-41092 Seville, Spain, Phone:+34 95 4488226, jesus.lopez- [email protected]; Universidad de A Coruña, Department of Economic Analysis and Business Administration, Faculty of Economics, 15071, Coruña, Spain, Phone: +34 981 167050, ext: 2451, email: [email protected].
Acknowledgements: Financial support from the Spanish Ministry of Science and Innovation through Grant ECO2011-28632 is gratefully acknowledged. The opinions, analyses and results of this work are the exclusive responsibility of the authors and do not represent the position of the European Commission. The usual disclaimer applies
1.Introduction
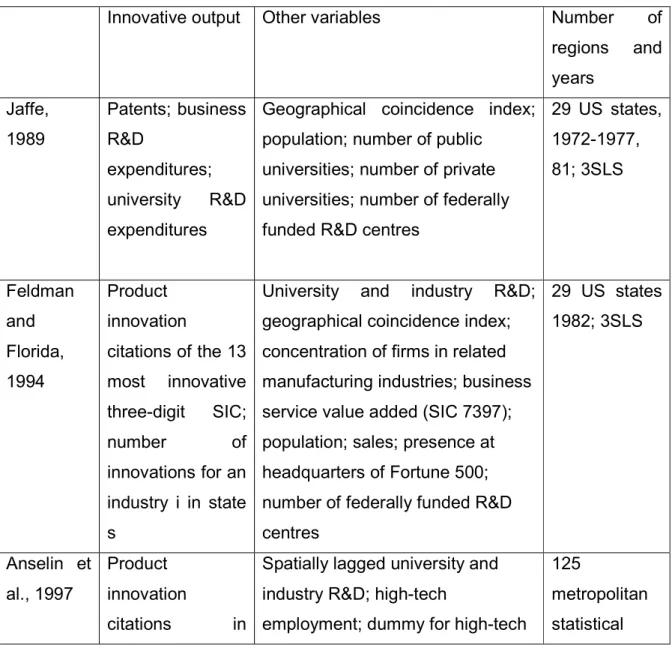
Since technological innovation is the key driver of long-term economic growth, scholars and policy makers should focus on understanding the sources and mechanisms behind innovations and new knowledge creation on national, regional and local levels. The regional capacity to sustain innovation is embodied in the region’s institutions and resources, which compose the region’s underlying technological infrastructure. This infrastructure includes three main elements: universities and research institutions that develop new scientific and technological knowledge, innovative companies that convert these technologies into industrial innovations, and the government, which provides support for industry and university R&D efforts. It has also been confirmed that the innovative process is circular and complex rather than sequential (from the laboratory directly to the marketplace) and that university R&D and private industry R&D positively influence each other through various channels of knowledge transmission (Kline and Rosenberg, 1987; Jaffe, 1989; Feldman and Florida, 1994).
Furthermore, as numerous examples show, the productivity and efficiency of a regional technological infrastructure depends heavily on the region’s endowment of human capital, with a high level of qualification and a spatial proximity among its main actors (Doloreux and Parto, 2005). For example, slightly more than half of the biotechnology firms in the United States are clustered in just three areas—Cambridge, Massachusetts, San Diego County and the San Francisco Bay area in California.
There is a rich literature analysing particular aspects of this complex process; however, few attempts have been made to explicitly investigate interdependence and dynamic linkages between university, business and public R&D efforts and their impact on knowledge creation.
A scholarly work by Jaffe (1989), using a novel measure of Griliches’ (1979) production function framework, was the first to explicitly investigate reciprocal university-industry relations for a sample of 29 US states over a disconnected period of eight years. In Jaffe’s analysis, corporate patents are the outcome of university and business R&D expenditures. He found that university research is an important source of innovation for the business sector and that university R&D depends on both a set of structural variables and business R&D.
However, in neither his global model nor in different technical areas, does he find evidence of a significant impact of industrial R&D on university R&D.
Inspired by the work of Jaffe (1989), Feldman and Florida (1994) investigated a very similar model but, instead of corporate patents, they consider commercial product innovation citations as a measure of innovative output. Moreover, they included among their independent variables the concentration of firms active in related manufacturing industries and specialized business services (Table 1).
Table 1. Selected studies on the influence of university and industry R&D efforts on knowledge creation
Innovative output Other variables Number of
regions and years
Jaffe, 1989
Patents; business R&D
expenditures;
university R&D expenditures
Geographical coincidence index;
population; number of public universities; number of private universities; number of federally funded R&D centres
29 US states, 1972-1977, 81; 3SLS
Feldman and Florida, 1994
Product innovation
citations of the 13 most innovative three-digit SIC;
number of
innovations for an industry i in state s
University and industry R&D;
geographical coincidence index;
concentration of firms in related manufacturing industries; business service value added (SIC 7397);
population; sales; presence at headquarters of Fortune 500;
number of federally funded R&D centres
29 US states 1982; 3SLS
Anselin et al., 1997
Product innovation
citations in
Spatially lagged university and industry R&D; high-tech
employment; dummy for high-tech
125
metropolitan statistical
aggregated high- tech sectors (SIC 28,35-38);
employment in high-tech
research labs;
university and business R&D expenditures
university department; dummy for presence of at least 10
headquarters of Fortune 500 in MSA; size of universities;
education expenditures
areas (MSA) 1982; 2SLS
Varga, 2000
Counts of product innovations introduced on the US market (two- digit SIC
industries)
Industrial R&D efforts; university R&D efforts in the respective engineering and hard sciences
125 U.S.
Metropolitan Statistical Areas (MSA) 1982
Acs, 2002 Number of patents;
innovation counts for industry i, in state k.
Spatially lagged university and industry R&D ; business services (SIC 73); and percentage of large firms; high-tech employment;
dummy for presence of at least 10 headquarters of Fortune 500 in MSA
43 US states
and 125
MSAs, 1982
Source: Own elaboration.
The authors provide evidence that both industrial and university R&D positively and significantly influence private business innovation, and that university R&D fuels industrial R&D. However, contrary to the findings of Jaffe (1989), the authors’ estimates show that the reverse also occurs, with private business R&D positively and significantly influencing university R&D.
Anselin et al. (1997) took one step further in a cross-section database by testing the knowledge production function of Griliches (1979) regression for a sample of 125 US
metropolitan areas. MSA-level results are obtained by using R&D laboratory employment as a proxy for R&D activity, based on a specially compiled data set. Like Jaffe (1989) and Feldman and Florida (1994), they found evidence of the positive impact of university R&D and industrial R&D on innovative output. Moreover, university R&D significantly influences private business R&D. Like Jaffe (1989), but contrary to Feldman and Florida (1994), Anselin et al.
found no evidence of a significant contribution of private business R&D to university research.
Whereas Narin et al. (1997) observed a threefold increase in the number of academic citations in industrial patents in the US through the mid-90s, which can be seen as a strong evidence on the growing integration between academic and private knowledge. Evidence contradicting the importance of university-industry cooperation was presented by Klevorick et al. (1995). He found that the direct impact of university research was small in most industries compared to other sources of information. Similar conclusion was made by Lee (1996), who surveyed 400 research ventures in the USA and found that most firms did not participate in any R&D cooperation with universities at all. Nevertheless, the major problem with studies by Lee (1996) and Narin et al. (1997) is that they suffer from a selectivity bias problem. Their analysis was based on selected groups, whose results cannot be used for generalization.
Varga (2000) examined both state and MSA levels and, using spatial econometric techniques, found a positive and a highly significant relationship between MSA innovations and university reasearch. He also showed the tendency for industries to be geographically clustered and suggested that spatial proximity to universities as inputs to R&D is critically important.
However, in comparison with the effect of industrial knowledge spillovers, the size of the university effect is considerably smaller. Finally, Acs (2002) found substantial evidence that knowledge spillovers are facilitated by the geographic coincidence of universities and research laboratories within the state.
Besides universities and the business sector, the third component of a region’s technological infrastructure is the government. Although, both Jaffe (1989; 1990) and Acs (2002) refer to the importance of the public sector and national laboratories as part of R&D infrastructure funding, they pursue little empirical studies of inter-linkages between government-funded and business R&D efforts or between universities and public R&D efforts. The rationales for public
sector involvement in R&D are manifold, e.g. to reduce the cost of R&D for private business, to strengthen the capacity of universities for knowledge creation in strategic fields, to stimulate industry-university cooperation, and to encourage universities to actively join global international research networks1. In sum, government involvement in the technological research domain is "aimed at bridging the resulting gap between private and socially optimal R&D efforts" (Suetens, 2002, p. 3).
Inspired by the above-mentioned subject literature, this research aims to contribute to a better understanding of the mechanisms and underlying factors of innovation and knowledge creation in US regions.
The authors extend past empirical evidence in several important respects: notably, by broadening spatial and time bases for the empirical analysis, by utilizing data for 40 US states and the 2000-2005 time period, compared to 29 US states and the period up to 1982 in the studies of Jaffe (1989) and Feldman and Florida (1994); highlighting the respective contributions of university and business R&D efforts and their feedback relation to knowledge creation in the US regions; defining how highly qualified human capital influences university and business R&D efforts; ascertaining whether the spatial clustering of production activity contributes to knowledge creation and innovation processes in the US regions; and identifying the role of the public sector in enhancing the regional innovation process in the US.
The authors argue that the capacity of regions and locations to create knowledge and innovations requires first that their knowledge absorption and transfer capacities are developed. In other words, the capacity of regions to integrate and create new technologies depends on their capacity to absorb technologies developed elsewhere and the efficiency of their innovation systems interconnecting universities, private enterprises and the government.
Absorption capacity is considered a precondition for potential knowledge creation and transfer capacity. The concept of absorptive capacity was originally designed in the context of firm theory, where knowledge is needed for a firm’s staff to understand and decode new knowledge (Cohen and Levinthal, 1989; Arora and Gambardella, 1994). However, this
1For an overview of the effects of different government policy instruments on private R&D see Guellec and van Pottelsberghe (2001).
concept could also be applied to regions. If a local economy lacks the capability to absorb technical knowledge produced locally or elsewhere, then how can it fully exploit innovations and create positive effects for its economy? The authors draw on the absorptive capacity hypothesis of Capron (2002) and the concept of “social capability” of Abramovitz (1986), who link the absorptive capacity to country`s or region`s technical competences, which is generally proxied by educational indicators.
With respect to knowledge transfer capacities the authors consider R&D intensities and university-private research partnerships as a proxy of knowledge transfer within the technological infrastructure of regions (Dosi, 1988; Cooke et al. 2000). Direct measures of knowledge transfer among institutional sectors such as higher education, the private business sector and the government sector are not available. R&D intensities can be imperfect proxies of knowledge transfer capacity, especially when they are combined with the regional endowment of knowledge-intensive industries (Bessant and Rush, 1995; Capron, 2002;
Cincera, 2003; Greunz, 2004).This can be true especially in the case of large firms, where knowledge and information are transferred via internal functional interaction among R&D, production, marketing and strategic-planning departments. Put otherwise, learning springs from cooperation and interaction between firms and the local scientific system (between production and R&D, between marketing and R&D). This way, investment in R&D could foster knowledge transfer and technological innovation that improve total factor productivity (Romer, 1990; Aghion and Howitt, 1992; Grossman and Helpman, 1991).
The spatial clustering of production activities is another form of knowledge transfer. Most formal and informal mechanisms of knowledge transfer and diffusion depend significantly on spatial proximity. For example, local labour markets of scientists and engineers promote local knowledge transfer, since they are more likely to move to nearby firms when changing jobs (Bania et al., 1992).
With respect to public support for universities, since governments run research institutes, finance higher education and subsidize R&D initiatives, one could expect that government support would stimulate private university R&D efforts, while public funding of R&D for the business sector may be questionable. It could encourage, substitute or crowd out private R&D efforts. For example, a study by Guellec and van Pottelsberghe (1999) shows that the
defense component of government research has a negative impact on business-funded R&D, whereas civilian R&D has no impact. Furthermore, the authors claim that fiscal incentives and direct funding stimulate business-funded R&D, whereas government research appears to have a crowding out effect. This implies that direct financial support is more effective than an indirect supply of knowledge as a policy instrument for enhancing business R&D outlays.
This paper is structured as follows. The first three sections provide some useful facts and figures that highlight the heterogeneity of the US regional landscape regarding its capacity for knowledge absorption, transfer and creation. The authors examine different kinds of indicators, firstly, by positioning the US regions in terms of patenting activity, and secondly by looking at R&D expenditures and qualification levels. The fifth section examines the spatial concentration of industrial activity in US regions and its role in the process of knowledge creation in these regions. The sixth section introduces a simultaneous equation model based on a modified knowledge production function of Griliches (1979) to empirically assess university-industry R&D linkages, the role of highly qualified human capital, spatial concentration and the public sector in the knowledge production process in the US regions.
Finally, the seventh section presents the main conclusions.
2. Knowledge Creation Capability of the US Regions
New knowledge can actually take different forms, i.e. embodied knowledge, tacit knowledge, know-how etc. Patents fall into the category of codified knowledge and are certainly a good and structured way to measure innovation and the knowledge creation capabilities of the U.S.
regions2. According to the USPTO-issued database, more than half of USPTO patents issued to the US come from seven US states: California, Texas, New York, Michigan, Massachusetts, New Jersey and Illinois (Table 2). These seven top patenting states are among the top 10 states that account for almost two-thirds of U.S. R&D expenditures.
2The greatest weakness of patents data as a measure of innovation and new knowledge creation is that not all innovations are patented, e.g. improvements in organizational principles, learning and craft.
California, which has the largest single share of any state, has shown a steady increase in its share from 15% in 1993 to 24% in 2005 (Science and Engineering Indicators 2008).
Table 2: The Number of Patents Granted Per Million Inhabitants by State and Year of Patent
2000 2001 2002 2003 2004 2005
ALABAMA 88,72 101,18 98,43 101,96 91,04 78,77
ARIZONA 339,92 321,19 312,61 307,65 301,40 269,06
ARKANSAS 92,22 82,85 78,70 64,56 58,18 55,05
CALIFORNIA 583,63 604,14 606,92 622,56 602,70 544,17 COLORADO 479,32 477,07 473,28 506,81 497,63 422,49 CONNECTICUT 611,03 602,77 575,70 528,99 492,43 478,02 DELAWARE 541,68 533,05 477,81 454,86 489,12 404,26 FLORIDA 194,97 192,59 171,13 183,60 172,04 152,17 GEORGIA 186,40 190,12 178,52 175,38 167,30 149,68 IDAHO 1243,38 1314,75 1396,61 1352,23 1305,96 1083,90 ILLINOIS 362,87 341,25 312,79 313,12 295,31 258,32 INDIANA 279,38 260,22 283,52 270,97 238,50 198,66
IOWA 230,84 278,04 232,08 241,72 249,25 212,05
KANSAS 176,40 141,81 185,44 180,23 197,53 166,14 KENTUCKY 127,69 134,50 121,32 120,73 111,79 90,33 LOUISIANA 129,32 125,64 108,16 97,76 85,87 65,88 MAINE 118,99 121,27 129,53 125,36 104,94 120,32 MARYLAND 279,58 29,93 296,20 286,44 258,93 229,27 MASSACHUSETTS 602,79 621,29 598,45 653,05 609,61 516,20 MICHIGAN 444,15 423,19 421,74 418,93 407,85 362,12 MINNESOTA 606,03 587,01 592,41 644,06 587,85 503,04 MISSOURI 173,02 171,53 169,34 165,42 155,39 126,20 MONTANA 158,27 178,79 166,96 136,18 141,33 127,18 NEVADA 200,18 177,10 169,75 203,42 204,04 183,45
NEW HAMPSHIRE 548,14 533,15 515,43 567,73 524,18 410,71 NEW JERSEY 521,36 504,30 477,72 453,93 386,18 328,98 NEW MEXICO 190,50 213,90 209,12 215,51 201,26 141,57 NEW YORK 370,44 375,98 369,17 359,84 343,24 275,62 NORTH CAROLINA 271,84 276,52 257,56 257,77 242,96 211,79 NORTH DAKOTA 152,85 168,18 135,74 97,94 103,72 127,22 PENNSYLVANIA 326,14 312,38 295,51 287,91 260,12 204,83 RHODE ISLAND 370,21 315,58 291,05 302,12 340,77 289,91 SOUTH CAROLINA 156,33 158,64 173,31 156,99 138,40 126,67 TENNESSEE 168,86 167,40 173,22 166,56 148,30 119,57 TEXAS 324,02 317,06 291,91 288,70 277,73 241,73
UTAH 353,52 351,00 319,69 304,79 323,87 260,77
VIRGINIA 180,74 177,84 178,70 168,76 157,99 136,11 WASHINGTON 346,29 376,48 379,14 410,36 393,42 394,74 WEST VIRGINIA 87,97 89,37 91,99 77,89 61,24 53,94 WISCONSIN 386,83 416,88 389,58 380,68 358,86 317,19
Source: U.S. Patent and Trademark Office,
http://www.uspto.gov/web/offices/ac/ido/oeip/taf/tafp.html
When patent output by U.S. states is adjusted for their population, however, the rankings change considerably. For example, a state with a small population, such as Idaho, is ranked first in its per capita output of U.S. patents in 2005. Two of the six top patenting states, California and Massachusetts, remain highly ranked on a per capita basis. The US ability to maintain its leading position in wealth and knowledge creation in the world, especially in the high-tech fields, highlights the importance of a better understanding the innovation process in the US by devoting special attention to the various sources of knowledge creation.
3. Knowledge Absorption Capacity of the US Regions
Knowledge absorption capacity is particularly strong in the southwestern and northeastern part of the US. Table 3 gives an overview of the current social capabilities of the US regions.
The following ten US states: California (25,93), Colorado (30,94), Hawaii (25,58), Illinois (26,08), Kansas (25,19), Maryland (31,13), Massachusetts (34,07), New York (27,59), Rhode Island (25,93) and Washington (27,32) achieved a significant, above-average educational attainment during the period 2000–2005. Knowledge absorption and social capability is also strong in Connecticut and New Jersey, which have among the highest levels of educational attainment. Furthermore, Michigan (21,99), Nebraska (23,51), New Mexico (21,69), North Dakota (22,07), Oregon (24,08) and Utah (22,83) also have well-developed social capabilities. Although their percentage of the labour force with advanced education is average, the qualification level of the working age population is high.
Table 3: Knowledge absorption capacities of the US regions in 2000–2005
Students enrolled in tertiary education as a percentage of the population
Percentage of the labour force with advanced educational qualifications
High Medium Low
High
California (25,93) Colorado (30,94) Hawaii (25,58) Illinois (26,08) Kansas (25,19) Maryland (31,13) Massachusetts (34,07)
New York (27,59) Rhode Island (25,93) Washington (27,32
Connecticut (31,85) Delaware (24,5) Minnesota (27,21) New Jersey (30,37) Virginia (29,58)
New Hampshire (28,51) Vermont (28,79)
Medium
Michigan (21,99) Nebraska (23,51) New Mexico (21,69) North Dakota (22,07) Oregon (24,08) Utah (22,83)
Alaska (23,82) Florida (22,62) Missouri (21,84) North Carolina (21,96)
Texas (22,06) Wisconsin (21,78)
Georgia (22,75) Maine (22,77) Montana (23,49) Pennsylvania (22,68)
Low
Arizona (21,54) Idaho (20,27) Iowa (21,28) Louisiana (18,34) Oklahoma (19,34) Wyoming (21,49)
Alabama (19,04) Arkansas (16,9) Indiana (19,15) Kentucky (17,08) Mississippi (16,86) Nevada (17,42) Ohio (20,69)
South Carolina (21,46) South Dakota (21,56) Tennessee (19,66) West Virginia (14,95)
Source: Own elaboration based on OECD Regions at a Glance: 2009
A common feature of Alabama (19,04), Arkansas (16,9), Indiana (19,15), Kentucky (17,08), Mississippi (16,86), Nevada (17,42), Ohio (20,69), South Carolina (21,46), South Dakota (21,56), Tennessee (19,66) and West Virginia (14,95) is their low level of students enrolled in tertiary education and low percentage of the labour force with advanced educational qualifications. The absorption capacity of these regions is generally low. Both the qualification level of their working age population and their participation in tertiary education are far below the US average.
4. Knowledge Transfer Capacity of the US Regions
State regions that bring together both high R&D intensities and important employment concentrations in knowledge-based sectors have the highest potential for knowledge creation and transmission. This is the case for most of Massachusetts, Michigan, Washington, Connecticut and California (Figure 1).
Given the extremely low levels of overall R&D intensity in such states as Florida, Louisiana, Wyoming, South Dakota, New York and Arizona, it is questionable whether sufficient resources are devoted to the development of knowledge transmission mechanisms such as private-public interfaces.
Fig. 1. Intensity3 of total R&D and knowledge-based sectors (2000-2005 average) in US states4
Source: Own elaboration based on OECD Regions at a Glance: 2009
3 Formally, the measure is defined as follows: where i indexes the region, k indexes the institutional sector, R&D stands for research and development expenditures and GDP for gross domestic product. A value of 1 indicates a performance equal to the US average. A higher / lower value indicates a higher / lower performance in comparison to the average.
4 Alabama, AL; Arizona, AZ; Arkansas, AR; California, CA; Colorado, CO; Connecticut, CT; Delaware, DE;
Florida, FL; Georgia, GA; Idaho, ID; Indiana, IN; Iowa, IA; Kansas, KS; Kentucky, KY; Louisiana, LA; Maine, ME;
Maryland, MD; Massachusetts, MA; Michigan, MI; Minnesota, MN; Mississippi, MS; Missouri, MO; Montana, MT;
Nebraska, NE; Nevada, NV; New Hampshire, NH; New Jersey, NJ; New Mexico, NM; New York, NY; North Carolina, NC; North Dakota, ND; Ohio, OH; Oklahoma, OK; Oregon, OR; Pennsylvania, PA; Rhode Island, RI;
South Carolina, SC; South Dakota, SD; Tennessee, TN; Texas, TX; Utah, UT; Vermont, V; Virginia, VA; Virgin Islands, VI; Washington, WA; West Virginia, WV; Wisconsin, WI; Wyoming, WY.
Furthermore, south Alaska and the states of Georgia, Arkansas, Alabama and North Carolina suffer from a low endowment of knowledge-based sectors, a fact that further hampers the flow of knowledge and know-how. Knowledge-based sectors are best developed in Connecticut, Michigan, Massachusetts, Washington, California, New Mexico and Arizona.
It is interesting to observe that states with low potential for knowledge absorption and transmission are also characterized by low levels of knowledge creation. This is the case for Alabama, Arkansas, Indiana, Kentucky, Mississippi, Nevada, Ohio, South Carolina, South Dakota, Tennessee and West Virginia (Figure 2).
Fig. 2. R&D intensity (R&D) and patent applications per million population average 2000-2005 (US50=100)
Source: Own elaboration based on OECD Regions at a Glance: 2009
The indicator of patent applications relative to R&D intensity enables an appreciation of the efficiency of the state innovative system. Figure 2 illustrates that only a few US states are characterized by the relative correlation between R&D intensity (R&D) and patent application.
This is the case especially for Massachusetts, followed by Delaware, Minnesota, Connecticut, California, New Jersey and New Hampshire. These states bring together both high R&D
intensities and important employment concentrations in knowledge-based sectors, and therefore they have the highest potential for knowledge creation and transmission. Low potential for knowledge creation for a major part of the US states is explained by both low R&D intensities and low endowments of knowledge-based sectors.
5. The Role of Spatial Proximity in The Process of Knowledge Creation in the US Regions
Knowledge creation is a systemic, territorial process where the degree of proximity and interdependence of economic, political, social and cultural factors determine the efficiency of the regional innovation system. The “innovation milieu” approach (Aydalot, 1986), the
“industrial district” approach (Pyke and Sengenberger, 1992), the “regional innovation systems” approach (Braczyk et al., 1998), the “learning regions” approach (Morgan, 1997;
Florida, 1998) and the “cluster” approach (Porter, 2000), all consider regionally tied institutional and social variables as major determinants of innovation.
An index that reflects the degree of spatial concentration of a variable within a given entity is the Herfindahl index (HF) (Table 4). Its evolution over a period of time enables the assessment of whether an activity has become increasingly concentrated or, on the contrary, more evenly distributed. There are two main reasons why the HF was calculated here for manufacturing sector employment for the metro areas in 40 US states. Firstly, the agglomeration of different industries within an urban region fosters innovation due to the diversity of available local knowledge sources (Jacobs, 1969). Inter-industry spillovers are one of the most important sources of new knowledge creation in the states. Secondly, despite the fact that technological progress in recent years has become increasingly generated by the service sector, industrial patenting activity is still dominant. Several observations emerge from the HF indexes presented in Table 4.
Table 4.Herfindahl index5 for the US regions for the period of 1995-2005
Source: Own calculations based on Employment in State and Metro Area statistical data, Bureau of Labor Statistics of the U.S. Department of Labor,
http://www.bls.gov/bls/infohome.htm
Firstly, manufacturing sector employment is spatially unevenly distributed in almost all the US states analysed. The highest values for the Herfindahl index in the period 1995-2005 are observed for California, Florida, Illinois, Massachusetts, Michigan, New York, Pennsylvania, Rhode Island, Texas and Washington. Table 3 also indicates that from 1995 to 2005, the spatial concentration of manufacturing employment increased steadily in Georgia, Nevada, Virginia, and West Virginia and declined in Arizona, Delaware and Minnesota. For Arkansas, Mississippi and Maine, employment in the manufacturing sector is the most evenly
5 The Herfindahl indices were calculated as follows: , where Si denotes the share of manufacturing employment of the metro region i of the total of state manufacturing employment, and n is the number of metro regions in a given state. The index is scaled from 0 to 1.
distributed. However, trends for the years 1995 up to 2005 suggest that this is becoming less pronounced in the latter states.
The fact that the US states are characterized by unequal social and knowledge transmission capacities as well as spatially bounded manufacturing activities leads us to question whether these features have any impact on the knowledge creation process across the US regions.
6. Knowledge Creation Function: An Empirical Analysis of the US Regions
The conceptual framework for analyzing university-industry linkages, the role of highly qualified human capital, spatial concentration and the influence of the public sector on innovative output of the US states is based on the knowledge production function of Griliches (1979) (see also Jaffe, 1986, 1989). Given expenditure on R&D as the input to innovative activity and the number of patents as the output, the knowledge production function shows the quantity of innovative input required to obtain a certain amount of innovative output:
KC = f(R&D) (1)
According to the knowledge production function framework initiated by Griliches (1979) and modified by Jaffe (1989), R&D investment is the main input for knowledge creation (KC), which is generally measured in terms of patent applications. The lower the input necessary to produce a given amount of output, the higher the efficiency of the “innovation system” is supposed to be.
This knowledge production function can be presented using a Cobb-Douglas-type production function, which does not impose any restriction regarding returns to scale.
&D output=a*(R&D input)*b*exp
R
ε (2)where a is a constant while b measures the elasticity of knowledge output with respect to input.
Taking natural logarithms in (2) leads to the equation:
ln (R&Doutput) = lna + bln(R&Dinput)+Ɛ (3)
To compare to what extent industry (IR&D) and university (UR&D) R&D explains granted patents and innovations in the US regions, the following model is estimated:
0 1 2 3 4 5 6
( )=ln + ln(UR&D)+ ln(IR&D)+ ln(HQ)+ ln(HM)+ ln(GDPpc)+ (HI)+
Ln P β β β β β β β ε (4)
Where
P stands for patent applications per capita by priority year at the state level per million inhabitants, 2000-2005;
UR&D represents total university R&D expenditure per capita by state, 2000-2005;
IR&D is the total industry R&D expenditure per capita by state, 2000-2005;
HQ represents the share of the labour force with advanced educational qualifications, 2000- 2005;
HM represents the share of high-tech manufacturing employment in total manufacturing, 2000-2005;
GDPpc represents real GDP per capita of US regions, 2000-2005 (as a variable measuring economic conditions);
HI is the Herfinthal index of the spatial concentration of manufacturing employment (HF index), 2000-2005;
and Ɛ represents the measurement error.
Following Jaffe (1989), the potential interaction between university and industry R&D is captured by extending the baseline equation (3) to capture the effects of industry and university R&D expenditures and the qualification level of the working-age population (HQ) on patent activity. The structure of the regional productive system is proxied by the share of
high-technology industry in its total employment (HM). The geographical proximity and its role in the potential transmission and capturing of knowledge spillovers is proxied by computing the Herfinthal index of the spatial concentration of manufacturing employment (HF index). Similarly, it is assumed, based on regional patent data, that a strong relationship between the number of patent applications per capita and GDP per capita exists, i.e., richer regions (states) invest more in patenting activity than poorer ones. As far as innovative output is concerned, it is proxied by patents granted by the U.S. Patent and Trademark Office. Even if patent data do not perfectly reflect innovations (Griliches, 1979) there is a strong link between patents and inventions (Guellec and van Pottelsberghe, 1999; Acs et al., 2002).
One of the problems related to the econometric estimation of the knowledge production function is the simultaneity of dependent and independent variables. For example, not all independent variables in the model are independent from other variables, e.g.
university‐industry R&D synergies. In order to reduce possible inconsistency of the model, the following system of equations is estimated:
1 2 3 4 5 6
( & )=ln + ln(UR&D)+ ln(FR&D)+ ln(S&T)+ ln(HQ)+ ln(HM)+
Ln IR D γ γ γ γ γ γ ξ(5)
1 2 3 4 5
( & )=ln + ln(IUR&D)+ ln(FUR&D)+ ln(HQ)+ ln(S&T)+
Ln UR D δ δ δ δ δ ζ (6)
Where
FR&D is total federal R&D expenditure per capita by state, 2000-2005;
FUR&D is total federal R&D expenditure at doctorate-granting institutions by state, 2000- 2005;
S&T represents the number of science and engineering graduates by state, 2000-2005;
Equation (5) explains industry R&D as a function of university and government R&D expenditures (UR&D and FR&D), the number of science and engineering graduate students, advanced educational qualifications of the labour force and the structure of the productive system. It has been suggested in the introductory section of the paper that university R&D fuels industry R&D through mechanisms of technology transfer and diffusion. Advanced educational attainment levels (HQ), number of science and engineering graduates (S&T) as
well as employment in high-tech industries are particularly important for the process of absorption, adaptation and creation of new technological knowledge, as the academic literature suggests.
Finally, equation (6) states that university R&D depends on industry and government R&D expenditures (IUR&D and FUR&D), the qualification level of the region’s workforce (HQ) and the number of science and engineering graduate students (S&T). Since the innovation process is created in multiple feedback loops, private business R&D is supposed to fuel university R&D (Kline and Rosenberg, 1987). Government R&D is another determinant of university R&D. The introduction of the variables of educational attainments (HQ and S&T) in the equation is motivated by the same arguments as those given in equation (5).
Econometric estimations are performed by means of a panel data estimation method that allows for random effects. Moreover, panel data offer many more degrees of freedom, provide the possibility of controlling for omitted variable bias and reduce the problem of multicollinearity; hence, the desired accuracy of the resulting parameter estimates increases (Hsiao, 1995).
The simultaneous system of equations has been estimated using two techniques: two-stage least squares (2SLS) and three-stage least squares (3SLS)6. The estimated model in equations 3, 4 and 5 is tested for the 40 US states over the period 2000-2005.
7. Estimates of the Simultaneous System of Equations
Globally, the results of the simultaneous system of equations indicate a high similarity between the estimates obtained by the different methods. However, if the estimated coefficients obtained by the two estimation methods are statistically similar, it is relatively difficult to choose a particular one. Klein (1974, p. 150) and Gujarati (1995, p. 679) argue that
6 The Ordinary Least Squares method (OLS) is not appropriate in our case since some variables are endogenous.
“single equation methods, in the context of a simultaneous system, may be less sensitive to specification errors in the sense that those parts of the system that are correctly specified may not be affected appreciably by errors in specification in another part”, and adopt the 3SLS method. The estimates of equation (4) indicate that patenting is positively influenced by the labour force with advanced educational qualifications, by the share high-tech manufacturing employment represents of total manufacturing and by the geographical concentration of production measured by means of the Herfindahl index. The coefficients for these variables are statistically significant at conventional critical values.
Table 5. Estimates of the simultaneous system of equations
Basic Model Lag Model
2SLS 3SLS 2SLS 3SLS
ln(P)
ln(UR&D) -0,111 (-0,93)
-0,103
ln(UR&D) -0,107 (-1,00)
-0,115
(-0,88) (-1,09)
ln(IR&D) -0,157 (-1,06)
-0,222 ln(IR&Dt- 3)
0,087 (1,77)
0,0713
(-1,56) (1,49)
ln(HQ) 1,130
(3,10)
1,374 ln(IR&Dt- 2)
0,126 (0,73)
0,028 (0,17) (4,04)
ln(HM) 0,719
(3,17)
0,828 ln(IR&Dt- 1)
-0,153 (-0,57)
-0,072 (-0,27) (3,74)
ln(GDP) 1,109
(2,97)
0,879
ln(HQ) 0,870 (2,93)
0,969 (3,36) (2,64)
ln(HF) 0,156
(3,13)
0,144
ln(HM) 0,627 (3,19)
0,696 (3,62) (3,36)
C -10,939 -9,349
ln(GDP) 0,814 (2,73)
0,734 (2,56) (-3,13) (-2,95)
ln(HF) 0,138 (3,07)
0,139 (3,25)
c -7,934
(-2,91)
-7,430 (-2,82)
R2 0,238 0,169 0,371 0,389 ln(IR&D)
ln(UR&D) 0,131 (0,50)
0,109
ln(UR&D) 0,102 (0,39)
0,100 (0,39) (0,43)
ln(FR&D) -0,078 (-1,58)
-0,096
ln(FR&D) -0,078 (-1,58)
-0,098 (-2,03) (-2,19)
ln(S&T) -0,182 (-1,97)
-0,128
ln(S&T) -0,180 (-1,95)
-0,176
(-1,48) (-1,94)
ln(HQ) 2,125
(3,76)
2,060
ln(HQ) 2,157 (3,82)
2,138
(3,70) (3,84)
ln(HM) 0,858
(1,79)
0,884
ln(HM) 0,858 (1,79)
0,943 (2,00) (1,88)
C -2,745
(-1,51)
-2,914
c -2,719
(-1,50)
-2,912 (-1,63) (-1,63)
R2 0,108 0,107 0,108 0,108
ln(UR&D)
ln(IUR&D) 0,124 (8,22)
0,124
ln(IUR&D) 0,124 (8,22)
0,126 (8,50) (8,38)
ln(FUR&D) 0,682 (41,40)
0,682
ln(FUR&D) 0,682 (41,40)
0,681 (41,91) (41,92)
ln(HQ) -0,042
(-1,03)
-0,041
ln(HQ) -0,042 (-1,03)
-0,042
(-1,01) (-1,03)
ln(S&T) -0,011 (-1,66)
-0,012
ln(S&T) -0,011 (-1,66)
-0,012 (-1,76) (-1,82)
C 1,616
(15,40)
1,618
c 1,616
(15,40)
1,616 (15,56) (15,58)
R2 0,943 0,943 0,943 0,943
nb observ 240 240 240 240
Source: Own elaboration based on the Bureau of Labor Statistics of the U.S. Department of Labor, The National Science Foundation (NSF) and The United States Patent and Trademark Office (USPTO).
Among the determinants of location choice for the firms’ R&D activities, the availability of qualified labour is listed as the most important determinant (Malecki, 1985; Galbraith and De Noble, 1988). Provided that knowledge sourcing and networking occur within local or regional boundaries these firms may contribute to the region’s knowledge creation and growth potential. Thus, it is not surprising that knowledge creation is positively related to advanced educational qualifications.
Considering that the US economy has substantial inequities in educational progress across the country (Table 3), strengthening the qualification levels improves the innovative performance of its regions. The level of education doesn’t only improve knowledge absorption but also the knowledge transfer capacity of regions, e.g. by attracting more private business R&D.
The local labour market can play a supportive role in technology diffusion. Employment in high-tech and medium-high tech industries and increased industrial activity could substantially increase R&D activities of the private business sector. The results suggest that local labour markets of scientists and engineers promote local technology transfer and knowledge creation, since these scientists and engineers are more likely to move to nearby firms when changing jobs (Bania et al., 1992).
Given the nature of the last two independent variables – education and employment levels – a potential spatial autocorrelation should be considered. Simon (1998) found “a positive, large, and persistent relationship” between the level of human capital and employment growth at the Metropolitan Statistical Area (MSA) level. Fagerberg et al. (1997) investigated the relationship between innovation and economic growth and found a positive relationship between them.
Thus, the analysis could be improved by taking into account potential spatial autocorrelation.
Furthermore, the results summarized in Table 5 show again that there is a positive relationship between geographical concentration of production (measured by the HF index), knowledge spillovers and innovative performance of US regions. In fact, one of the biggest benefits of clustering has to do with knowledge spillovers.
The results of many previous studies examining the impact of geographical proximity on localized knowledge spillovers prove that indeed spatial proximity matters in facilitating the transmission and absorption of knowledge (Griliches, 1995; Anselin et al., 1997; Acs et al., 2002). In sum, the US regions that bring together both high ratios of graduates with advanced education qualifications, a big share of employment in high-tech and a high level of manufacturing employment concentration have the highest potential for knowledge creation and transmission.
8. The Knowledge Production Model: Results for Industry R&D Efforts
One of the fundamental results of the model estimates is that university R&D and industry R&D fuel each other, indicating possible knowledge spillovers between these two sectors.
Furthermore, Table 4 suggests a striking observation. The estimating results suggest that government research may have a negative and significant impact on business-funded R&D.
Does this imply a possible crowding out effect? In fact, one could easily assume so since public laboratories are supposed to meet public goals, not those of business. Thus, the possible knowledge spillovers may occur but are not immediate. A number of studies have investigated the effectiveness of public innovation policies aimed at stimulating private R&D investment at various levels of aggregation. Some of them conclude that firms do not randomly participate in government R&D support programmes. Public R&D policy, to a large extent, tries to “pick winners” in programmes such as ATP, SEMATECH and SBIR7 (Irwin and Klenow, 1996; Lerner, 1998). Wallsten (2000) examined whether government-industry commercial R&D grants increase private R&D. He provides evidence that these grants crowd out firm-financed R&D spending dollar for dollar. Heshmati and Loof (2005) in their study evaluate whether firms receiving public funds have, on average, a higher R&D intensity compared to those not receiving such support. The results, based on a large sample of Swedish firms, support the hypothesis that the additive effects of public R&D financing on private R&D expenditures are observed only for small firms (Heshmati and Loof, 2005; Hanel,
7 The Advanced Technology Program (ATP), www.atp.nist.gov.; Semiconductor Manufacturing Technology (SEMATECH), www.sematech.org; and The Small Business Innovation Research (SBIR), www.sbir.gov.
2003). Jaffe (2002) shows that firms that spend their own R&D resources and already have high innovative performance, are more likely to receive government support. These findings suggest public funding may, in fact, be an endogenous variable and its inclusion in the list of independent variables might result in inconsistencies. The extent to which crowding out limits or enhances the social productivity of public research funding depends on the elasticity of supply of alternative sources of funds. This suggests further research is needed to better understand the relationship between public and private R&D financing.
Regarding the role of qualification within industry R&D activity, both a highly qualified labour force and a share of high-tech manufacturing employment positively influence private business R&D activities. Thus, despite the fact that the innovative activities of the service sector have gained in importance in recent years, industry is still a very important engine of technological change.
9. The Knowledge Production Model: Results For University R&D Efforts
The federal government and industry-funded R&D also significantly contribute to foster university R&D efforts in the selected sample of US regions. The results of the estimations clearly indicate that there is a significant and positive interaction between university R&D and industry R&D. Generally, a one percent increase of industry-funded R&D expenditure generates a 0,13 percent increase in university R&D. This result is lower than the one obtained by Feldman and Florida (1994) for the US case (0,22), however, it emphasizes the significance of transferring basic knowledge to firms for the knowledge-creation process in US regions. When investigating the case of federal government R&D, one can observe that federal R&D support significantly determines university R&D efforts. Thus, the federal government has an important role to play in strengthening university knowledge transfer capacities. Since university R&D is highly knowledge intensive, it is a little surprising that the model results indicate that the number of science and engineering graduates (S&T) negatively influenced university expenditure on R&D. The explanation for this outcome relates to the question whether research and teaching are complementary or competitive activities.
Some authors consider that one reinforces the other, whereas other authors perceive them as
“conflicting roles with different expectations and obligations” (Fox 1992, p. 293). The study conducted by Fox (1992) aimed to analyze how research and teaching activities influence the publication productivity of social scientists in US teaching on all programme levels (BA, MA and PhD). The study’s author suggests that faculty members with high publication productivity exhibit strong interest and commitment of time to research. The study results suggest that more productive researchers spend fewer hours teaching and preparing courses and consider teaching as less important than research.
10. Conclusions
This paper presents the results of estimations of a simultaneous equation model based on the Griliches (1979) knowledge production function framework. The model considers innovation output, provided by patent applications to the US Patent and Trademark Office (PTO) and R&D expenditures as a function of innovative inputs. Further on, the model controls for structural characteristics such as high-tech manufacturing employment as a percentage of total manufacturing, the qualification level of the region’s workforce and the spatial concentration of productive activity as an exogenous explanatory variable.
Given that the data for US metropolitan areas is hardly accessible for all model variables, the territorial aspects of the innovation process are probably not sufficiently assessed. Further territorial disaggregation would have allowed for deeper insight into the mechanisms of the innovation process and knowledge creation. However, since the paper’s aim was to apply the RIS concept, where input measures such as R&D expenditures or personnel influence patent activity, our model certainly provides a closer insight into the mechanisms driving the innovation process of the US states. The trends highlighted in this paper demonstrate that the expansion of the knowledge economy has given rise to a challenge related to the structure of economic activity across the states, mainly, regional polarization. Only a small number of US regions have developed high R&D intensities, have access to highly qualified human resources and record relatively high number of patents.
The research findings suggest that the knowledge creation and innovation capacity of US regions depends significantly on the regions` knowledge absorption and transfer capacities,
i.e., access to highly qualified labour force, employment in high-tech industries, positive university-industry R&D interaction and the geographical concentration of the manufacturing industry. Furthermore, the results suggest that government spending on R&D has a positive impact on university research efforts, but may crowd out private R&D spending. Therefore, the federal government should take action to enhance the level of support for academic R&D efforts (e.g. research grants to universities) as well as encourage greater intellectual interchange between industry and academia, rather than enhancing business R&D outlays.
References
Abramovitz, M., 1986 Catching up, forging ahead, and falling behind. Journal of Economic History, vol. XLVI/2.
Acs, J. Z., 2002. Innovation and the growth of cities. Edward Elgar Publishing.
Acs Z., Varga, A. and Anselin, L., 1997. Local geographic spillovers between university research and high technology innovations. Journal of Urban Economics, 422-448.
Aghion, p. and Howitt, P., 1992. A model of growth through creative destruction.
Econometrica, 60, 323-351.
Aydalot, P. (1986) Milieux innovateurs en Europe. GREMI, Paris.
Bania, N., Calkins, L. and Dalenberg, D., 1992. The effects of regional science and technology policy on the geographic distribution of industrial R&D laboratories, Journal of Regional Science, 32, 209-228.
Bessant, J. and Rush, H., 1995. Building bridges for innovation; the role of consultants in technology transfer. Research Policy, 24, 97-114.
Braczyk, H. J., Cooke, P. H., and Heidenreich, M. (Eds.) 1998. Regional Innovation Systems: The Role of Governance in a Globalized World. UCL Press, London.
Bresnahan, T. and Gambardella, A., 2004. Building High-Tech Clusters: Silicon Valley and Beyond. Cambridge University Press, 331-58.
Bottazzi, L. and Peri, G., 2003. Innovation and spillovers in regions: evidence from European patent data. European Economic Review, 47, 687-710.
Brewer, S. C., 1998. Human Capital and Metropolitan Employment Growth. Journal of Urban Economics, Vol. 43.
Capron, H., 2002. Transition towards the knowledge-based economy: growth potential and learning regions in Belgian Report on Science, Technology and Innovation, Volume II, Belgian Federal Office of Scientific.
Capello, R., 2006. Regional Economics, Routledge, 28.
Cincera, M., 2003. Spécial issue on the economics of knowledge spillovers: introduction and overview. Brussels Economic Review, 46(3), 5-10.
Cohen, W., Levinthal, M., and Daniel, A., 1989. Innovation and learning: The two faces of R&D. Economic Journal, 99, 569-596.
Cockburn, I. and Henderson, R., 1998. Absorptive Capacity, Coauthoring Behavior, and the Organization of Research in Drug Discovery. Journal of Industrial Economics, Wiley Blackwell 46(2), 157-82.
Crescenzi, R., Rodriguez-Pose, A., and Storper, M., 2007. The geographical processes behind innovation: a Europe-United States comparative analysis. Departmental Working Papers of Economics. University Roma.
Carayannis, E. and Campbell, D. (Eds.), 2006. Knowledge Creation, Diffusion and Use in Innovation Networks and Knowledge Clusters: a Comparative Systems Approach across the United States, Europe and Asia, Westport.
Doloreux, D. and Parto, S., 2005. Regional innovation systems: current discourse and unresolved issues, Technology and Society, 27(2):133.
Doloreux, D. and Bitard, P., 2005. Les systèmes régionaux d'innovation: discussion critique, Géographie Économie Société, 7, 21-36.
Doloreux, D., 2003. Regional innovation systems in the periphery: The case of the Beauce in Quebec (Canada). International Journal of Innovation Management, 7(1), 67- 94
Heshmati, A. and Loof, H., 2005. The Impact of Public Funds on Private R&D Investment: New Evidence from a Firm Level Innovation Study, Discussion Papers 11862, MTT Agrifood Research Finland.
Hanel, P., 2003. Impact of government support programmes on innovation by Canadian manufacturing firms. Paper presented at Conference: Evaluation of government funded R&D activities, May 2003, Vienna.
Hsiao, Ch., 2003. Analysis of Panel Data, Cambridge Books, Cambridge University Press.
Fagerberg, J., Verspagen, B., and Caniëls, M., 1997. Technology, Growth and Unemployment across European Regions, Regional Studies, 31(5), 457-66.
Florida, R., 1998. Calibrating the learning region. In: De la Mothe, John, Paquet, Gilles (Eds.) Local and regional systems of innovation. Kluwer Academic Publishers, London.
Feldman, M. P. and Florida, R., 1994. The Geographic Sources of Innovation:
Technological Infrastructure and Product Innovation in the United States. Annals of the Association of American Geographers, 84(2), 210-229.
Fox, M. F., 1992. Research, teaching, and publication productivity: mutuality versus competition in academia. Sociology of Education, 65(4), 293-305.
Galbraith, C. and De Noble, A. F., 1988. Location decisions by high technology firms: a comparison of firm size, industry type and institutional form. Entrepreneurship Theory and Practice, 13, 31-48.
Greunz, L., 2004. Interregional knowledge spillovers in Europe. ULB Institutional Repository 2013/9483.
Grossman, G. M. and Helpman, E., 1991. Innovation and growth in the global economy.
Cambridge, MIT Press.
Glaeser, E., Kallal, H., Scheinkam, J. and Shleifer, A., 1992. Growth in Cities, The Journal of Political Economy, 100, 1126-1152.
Guellec, D. and van Pottelsberghe de la Potterie, B., 2003. From R&D to Productivity Growth: Do The Institutional Setting and The Source of Funds of R&D Matter? Institute of Innovation Research Working Paper, Hitotsubashi University, November 2003, No 03- 25.
Keeble, D. and Wilkinson, F., 2000. High-Technology Clusters Networking and Collective Learning in Europe, Aldershot: Ashgate, 199-229.
Keller, W., 2002. Geographic Localization of International Technology Diffusion.
American Economic Review 92, 120-142.
Klevorick, A.K., Levin, R.C. Nelson, R.R. Winter S.G., 1995. On the sources and significance of interindustry differences in technological opportunities, Research Policy 24: 185-205.
Irwin, D. A. and Klenow, P. J., 1996. High-tech R&D subsidies – estimating the effects of SEMATECH, Journal of International Economics 40.
Jaffe, A., (1989) Real effects of academic research. The American Economic Review 79, 957-970.
Jaffe, A., 2002. Building Programme Evaluation into the Design of Public Research- Support Programmes. Oxford Review of Economic Policy, 18 (1, 2002), 22-34.
Lerner, J. 1998. The government as venture capitalist: The long-run impact of the SBIR program. Mimeo, Harvard University.
Lee, Y. S.,1996. Technology Transfer' and the Research University: a Search for the Boundaries of University--Industry Collaboration, Research Policy 25, 843-863
Link, A. N., 1982. An analysis of the composition of R&D spending. Southern Economic Journal, 49(2), 342-349.
Mansfield, E., 1991. Academic Research and Industrial Innovation. Research Policy 20(1), 1–12.
Malecki, E., 1985. Industrial location and corporate organization in high-technology industries. Economic Geography, 61, 345-367.
Morgan, K., 1997. The Learning Region: Institutions, Innovation and Regional Renewal.
Regional Studies, 31(5), 491-503.
Narin, F., Hamilton, K., Olivastro, D., 1997. The increasing linkage between US technology and public science. Research Policy 26 (3), 317–330.
Faiña, A. J. and Lopez Rodriguez, J. (2007) Human Capital Accumulation and Geography: Empirical Evidence from the European Union. Journal of Regional Studies, 42, 217-234.
Lundvall, B.Å.,1992. National Systems of Innovation: Towards a Theory of Innovation and Interactive Learning, Pinter, London.
Organisation for Economic Co-operation and Development (OECD) Regions at a Glance: 2009, OECD Publishing, 23 Mar 2009, Paris.
Porter, M., 2000. Location, competition and economic development: local clusters in a global economy. Economic Development Quarterly 14, 15-34.
Pyke, F. and Sengenberger, W., 1992. (Eds.) Industrial Districts and Local Economic Regeneration, Geneva, International Institute for Labor Studies.
Rodriguez-Pose A. and Crescenzi, R., 2006. R&D, Spillovers, Innovation Systems and the Genesis of Regional Growth in Europe, ERSA conference papers, European Regional Science Association, 371.
Romer, P., 1990 Endogenous Technological Change. Journal of Political Economy 98,71-102.
Science and Engineering Indicators 2008, www.nsf.gov/statistics/seind08/c6/c6s.htm Suetens, S., 2002. R&D subsidies and production effects of R&D personnel: evidence from the Flemish region. CESIT Discussion Paper 2002/03. Antwerp.
Wallsten, S. J., 2000. The effects of government-industry R&D programs on private R&D: The case of The Small Business Innovation Research Program, RAND Journal of Economics 31(1), 82-100.
Varga, A., 2000. Local Academic Knowledge Transfers and the Concentration of Economic Activity. Journal of Regional Science 40(2), 289-309.
Appendix: Correlation Matrix
Correlations
P RD HM HQ HF
P Pearson Correlation
1 .256** .223** .239** .359**
Sig. (2-tailed) .000 .001 .000 .000
N 240 239 240 240 240
RD Pearson Correlation
.256** 1 .491** .646** .514**
Sig. (2-tailed) .000 .000 .000 .000
N 239 239 239 239 239
HM Pearson Correlation
.223** .491** 1 .395** .170**
Sig. (2-tailed) .001 .000 .000 .008
N 240 239 240 240 240
HQ Pearson Correlation
.239** .646** .395** 1 .409**
Sig. (2-tailed) .000 .000 .000 .000
N 240 239 240 240 240
HF Pearson Correlation
.359** .514** .170** .409** 1
Sig. (2-tailed) .000 .000 .008 .000
N 240 239 240 240 240
**. Correlation is significant at the 0.01 level (2-tailed).
F
UNDACIÓN DE LASC
AJAS DEA
HORROS DOCUMENTOS DE TRABAJOÚltimos números publicados
159/2000 Participación privada en la construcción y explotación de carreteras de peaje Ginés de Rus, Manuel Romero y Lourdes Trujillo
160/2000 Errores y posibles soluciones en la aplicación del Value at Risk Mariano González Sánchez
161/2000 Tax neutrality on saving assets. The spahish case before and after the tax reform Cristina Ruza y de Paz-Curbera
162/2000 Private rates of return to human capital in Spain: new evidence F. Barceinas, J. Oliver-Alonso, J.L. Raymond y J.L. Roig-Sabaté 163/2000 El control interno del riesgo. Una propuesta de sistema de límites
riesgo neutral
Mariano González Sánchez
164/2001 La evolución de las políticas de gasto de las Administraciones Públicas en los años 90 Alfonso Utrilla de la Hoz y Carmen Pérez Esparrells
165/2001 Bank cost efficiency and output specification Emili Tortosa-Ausina
166/2001 Recent trends in Spanish income distribution: A robust picture of falling income inequality Josep Oliver-Alonso, Xavier Ramos y José Luis Raymond-Bara
167/2001 Efectos redistributivos y sobre el bienestar social del tratamiento de las cargas familiares en el nuevo IRPF
Nuria Badenes Plá, Julio López Laborda, Jorge Onrubia Fernández
168/2001 The Effects of Bank Debt on Financial Structure of Small and Medium Firms in some Euro- pean Countries
Mónica Melle-Hernández
169/2001 La política de cohesión de la UE ampliada: la perspectiva de España Ismael Sanz Labrador
170/2002 Riesgo de liquidez de Mercado Mariano González Sánchez
171/2002 Los costes de administración para el afiliado en los sistemas de pensiones basados en cuentas de capitalización individual: medida y comparación internacional.
José Enrique Devesa Carpio, Rosa Rodríguez Barrera, Carlos Vidal Meliá
172/2002 La encuesta continua de presupuestos familiares (1985-1996): descripción, representatividad y propuestas de metodología para la explotación de la información de los ingresos y el gasto.
Llorenc Pou, Joaquín Alegre
173/2002 Modelos paramétricos y no paramétricos en problemas de concesión de tarjetas de credito.
Rosa Puertas, María Bonilla, Ignacio Olmeda
174/2002 Mercado único, comercio intra-industrial y costes de ajuste en las manufacturas españolas.
José Vicente Blanes Cristóbal
175/2003 La Administración tributaria en España. Un análisis de la gestión a través de los ingresos y de los gastos.
Juan de Dios Jiménez Aguilera, Pedro Enrique Barrilao González
176/2003 The Falling Share of Cash Payments in Spain.
Santiago Carbó Valverde, Rafael López del Paso, David B. Humphrey Publicado en “Moneda y Crédito” nº 217, pags. 167-189.
177/2003 Effects of ATMs and Electronic Payments on Banking Costs: The Spanish Case.
Santiago Carbó Valverde, Rafael López del Paso, David B. Humphrey
178/2003 Factors explaining the interest margin in the banking sectors of the European Union.
Joaquín Maudos y Juan Fernández Guevara
179/2003 Los planes de stock options para directivos y consejeros y su valoración por el mercado de valores en España.
Mónica Melle Hernández
180/2003 Ownership and Performance in Europe and US Banking – A comparison of Commercial, Co- operative & Savings Banks.
Yener Altunbas, Santiago Carbó y Phil Molyneux
181/2003 The Euro effect on the integration of the European stock markets.
Mónica Melle Hernández
182/2004 In search of complementarity in the innovation strategy: international R&D and external knowledge acquisition.
Bruno Cassiman, Reinhilde Veugelers
183/2004 Fijación de precios en el sector público: una aplicación para el servicio municipal de sumi- nistro de agua.
Mª Ángeles García Valiñas
184/2004 Estimación de la economía sumergida es España: un modelo estructural de variables latentes.
Ángel Alañón Pardo, Miguel Gómez de Antonio
185/2004 Causas políticas y consecuencias sociales de la corrupción.
Joan Oriol Prats Cabrera
186/2004 Loan bankers’ decisions and sensitivity to the audit report using the belief revision model.
Andrés Guiral Contreras and José A. Gonzalo Angulo
187/2004 El modelo de Black, Derman y Toy en la práctica. Aplicación al mercado español.
Marta Tolentino García-Abadillo y Antonio Díaz Pérez 188/2004 Does market competition make banks perform well?.
Mónica Melle
189/2004 Efficiency differences among banks: external, technical, internal, and managerial Santiago Carbó Valverde, David B. Humphrey y Rafael López del Paso