THE VALUATION OF SPANISH IPOs:
EFFICIENCY ANALYSIS
Susana Álvarez Otero
FUNDACIÓN DE LAS CAJAS DE AHORROS DOCUMENTO DE TRABAJO
Nº 216/2005
De conformidad con la base quinta de la convocatoria del Programa de Estímulo a la Investigación, este trabajo ha sido sometido a eva- luación externa anónima de especialistas cualificados a fin de con- trastar su nivel técnico.
ISBN: 84-89116-07-5
La serie DOCUMENTOS DE TRABAJO incluye avances y resultados de investigaciones dentro de los pro- gramas de la Fundación de las Cajas de Ahorros.
Las opiniones son responsabilidad de los autores.
THE VALUATION OF SPANISH IPOs:
EFFICIENCY ANALYSIS
Susana Álvarez Otero University of Oviedo
Abstract
The aim of this paper is to analyze the efficiency of the pricing process of firms that went public on Madrid Stock Exchange during the period 1985-1997. Results show that underwriters do not fully incorporate all the available information. Both prior market returns and some of the firm- and deal-specific characteristics are significantly related to the price update. We find that underwriters similarly disregard some private information when they set the final offer price. However, it seems that underwriters incorporate the vast majority of public information into the final offer price. Thus, underwriters´ treatment of private information appears to be consistent with an efficient IPO pricing process at the semistrong form in the Spanish capital market.
JEL Codes: G14, G32
Key words: Pricing process, efficiency, underwriter, IPOs.
_______________________________________
Postal addresss:
Dpto. de Administración de Empresas y Contabilidad Avda. del Cristo, s/n
33071 Oviedo. SPAIN.
Tlf: ++34985102820; Fax: ++34985103708; e-mail: [email protected]
THE VALUATION OF SPANISH IPOs:
EFFICIENCY ANALYSIS
1. Introduction
The positive initial return of initial public offerings (IPOs) is one of the more enduring puzzles in financial economics. The pricing phenomenon shows that not all the available information is incorporated by underwriters into the offer price. In consequence, prior literature has found significant relations between the information known by underwriters before the IPO and the initial return of the offer, which is consistent with efficient markets, for some of these relations.1
The shares of firms that have gone public have been offered to investors at prices that, on average, are considerably lower than the price that they later trade at, on the stock market.
Following Ibbotson (1975) and Ritter (1984), numerous researchers have found that in different countries and at different points in time, the phenomenon of the underpricing of IPOs is a generalised phenomenon. More recently, different studies have analysed the long-run performance of IPOs. This analysis has revealed that investors seem to obtain losses due to holding shares of the firms that have recently carried out an IPO compared to those firms that have not done so. Taking as a starting point the work of Ritter (1991), several studies have shown the existence of negative long-run abnormal returns for firms at five years following the IPO. This phenomenon has been reported in both the USA and other markets.
1The positive relationship between initial returns and level of uncertainty prior to the offer is consistent with underwriters compensating investors for the higher costs of learning about such firms. Additionally, Benveniste and Spindt (1989) have found that private information learned during the filing period is only partially incorporated into the offer price; this fact is consistent with underwriters rewarding institutional
Several papers have shown the existence of positive initial returns on Spanish IPOs, on the range of around 11%, in line with the evidence reported in other countries (Freixas and Inurrieta, 1991; Fernández et al., 1993 and Álvarez, 2001). Evidence on the long-run performance of IPOs in Spain is scarce. Farinós (2001) shows that IPO firms do not underperform in the period of 1 and 3 years after the IPO, but with a small sample size of 18 firms. However, Alvarez and González (2005) in a recent study, with a sample of 52 IPOs, reveal the existence of negative long-run abnormal stock returns, in line with the international literature.
An efficient IPO mechanism is one that maximizes expected proceeds. However, the challenge is the opposing interests of the issuer and investors. While the issuer wants to maximize the offer price, investors want to minimize it. Complicating matters is the presence of private information. Issuer management knows far more about the true firm value than investors. Underwriter reputation concerns and legal liability are sufficient to prevent the issuer from exploiting its inside information and setting too high a price.
Investors also have private information, the maximun price each is willing to pay.
Collectively, investors want to understate their interest in the IPO to drive the offer price down. The ability of a mechanism to induce investors, to pay their private valuation determines its efficiency.
A matter of recent debate is the extent to which public information is incorporated into the pricing. Some studies suggest that public information is only partially incorporated into the offer price (Loughran and Ritter, 2002), even though others would not predict this (Benveniste and Spindt, 1989). This partial incorporation of public information seems to suggest that the IPO pricing process is not efficient. Empirical evidence contains different predictions on the effects of private versus public information in the pricing process
(Benveniste and Spindt, 1989). Informed investors provide underwriters with private information about the value of the IPO firm during the filing period.
Theorically, underwriters compensate these investors for the private information they provide by only partially incorporating it into the offer price, thus allowing the informed investors to earn especially high returns on the first day the IPO firm trades. In contrast, it is difficult to conjecture why the incomplete incorporation of public information into the offer price would be consistent with efficient markets. By definition, such information is available to all markets participants, including the underwriter and the issuing firm. Thus, the underwriter does not need to compensate any one group of investors for providing this information. In fact, by not fully incorporating public information, the underwriter seems to “freely” reward all buyers of these IPO at the expense of the issuer. Yet Loughran and Ritter’s (2002) findings suggest that underwriters do just that.
The objective of this paper is to examine underwriters´ treatment of public information throughout the entire IPO pricing process, and thereby shed light on the extent to which the IPO price-setting process is efficient. This type of analysis has been done for other markets.2 The contribution of this paper is the analysis for the Spanish capital market, which is different in terms of the different methods to go public and the pricing of shares in these methods. In consequence, this analysis contributes to shed more light on the international pricing methods for firms that go public.
While empirical studies have been carried out previously, these are mainly related to the IPOs in the US and the results have produced conflicting findings; within this context, the characteristics of the Spanish capital market increase the interest of this efficiency analysis.
The conclusions from previous research cannot be automatically imputed to Spain, because
in this country there are different methods to go public. In consequence, the pricing analysis in this case must be done taking into account the different methods to go public in the Spanish capital market. To do so, we analyze the pricing of firms that have begun to quote on the Spanish stock exchange during the period 1985 to 1997. The reason to choose this particular period is that it includes firms going public with different methods in approximately equivalent proportion. From 1995 onwards almost all firms use the same method ⎯ book-building⎯.
The rest of the paper is structured in the following way: section 2 discusses the data used to examine the price updates and initial returns, according to the characteristics of the Spanish capital market. The database comprises the firms that started quoting on Madrid Stock Exchange in the period 1985 to 1997. Section 3 investigates the explanation of IPO pricing and the differences with respect to other methods to go public while section 4 investigates the relation between the initial returns and the price update. Finally, section 5 summarizes the main results of the paper.
2. Database and methodology
The database used to analyze the pricing process is made up of the 115 listings on Madrid Stock Exchange from 1985 to 1997. The period of study is cut in 1997, in order to have a proportional number of firms going public with the different methods that exist on the Spanish capital market during that period. From 1995 onwards almost all firms choose the book-building method. As well as Initial Public Offerings (IPO), there exist on the Spanish stock exchange three other ways of starting to quote on the market: direct entry, private placements and, in very few cases, mixed placements. This fact increases the interest in the Spanish market, in comparison with the countries that use only IPOs, because it is possible to analyze the differences in efficiency between the three types of methods to go public.
The sample was screened to eliminate foreign firms who began to quote on the Spanish market, due to these shares having already quoted on other stock markets and also mixed placements, due to the irrelevant number. This is why the number of listings analyzed was 111.
Direct entry is a method by which admission is requested to quote shares that are in the hands of the shareholders. Private placements consist in offering a limited number of shares to a specific group of investors (institutional investors, employees,....) and try to achieve a greater shareholder stability. Private placements are compatible with IPOs and vice versa, giving rise to mixed placements, which by means of an adequate combination of one and the other method mean that the advantages of both systems may be obtained.
Among public offerings there are fixed priced offers and others that use the book-building process.
This database was obtained from the information contained in the offering prospectuses elaborated by the firms to request their admission to the market and were made available by the Madrid Stock Exchange for issues that took place between 1985 and 1989 and by the Comisión Nacional del Mercado de Valores (C.N.M.V.) (Spanish SEC) for the years subsequent to 1989. The economic-financial information comes from the databases elaborated by the C.N.M.V.
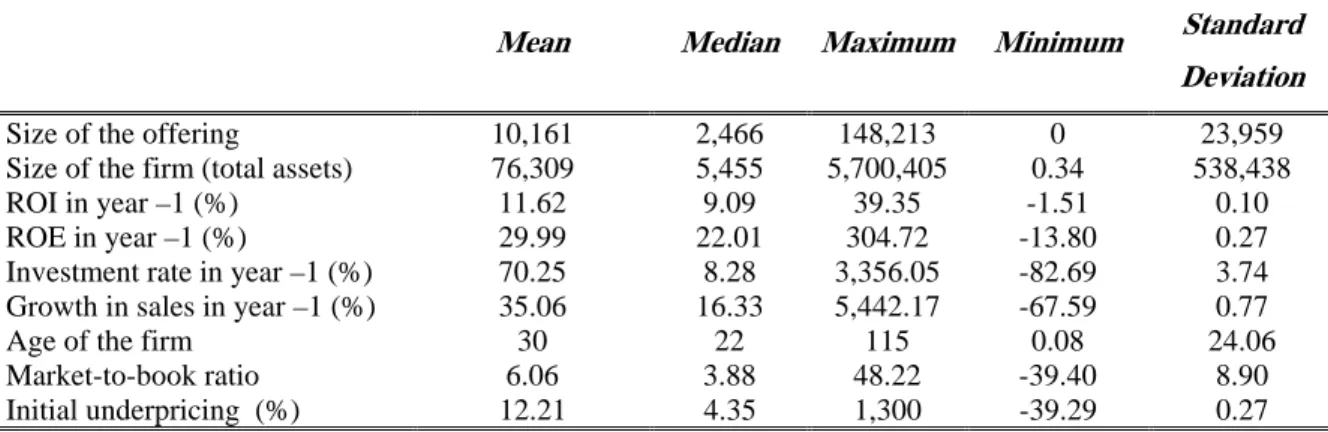
The characteristics of the sample are shown in Table 1a. The firms that started quoting are firms with high levels of returns; if we consider the average values of return on assets in the year prior to going public, these were found to be 11.62%, whereas return on equity at that same moment in time were 30%. Likewise, the market-to-book ratio, calculated at the end of the first day of trading, has an average value of 6.06, indicative of high growth perspectives or the existence of overpricing at the initial moment. Moreover, these are
firms that have grown substantially in the year prior to going public in both total volume of assets, 70.25%, and sales volume, 35.06%.
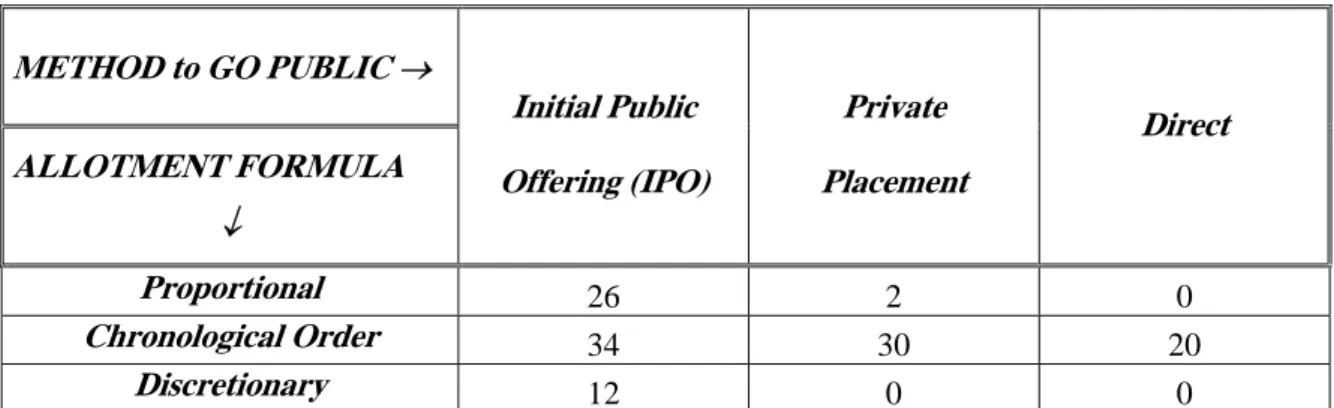
Spanish legislation does not specify what the formulae must be to allocate the securities that begin to be traded on the stock market, and does not establish any requirement as regards the form of allotment of the same. It merely requires the inclusion in the prospectus, detailed information as to the form which is going to be used to assign the securities. The current assignation methods are proportional, chronological order and discretionary, and the selection of the ideal form is in function of the type of shareholder to which one wishes to accede. Table 1b shows the relationship of the allotment formulae in accordance with the various methods to go public, over the base of the sample companies.
With regard to the IPOs one can see the use of the various current forms of allocation, sometimes combined together in the same offer, while as regards private or direct inscription, the distribution of the shares tends to be by chronological order.
For firms following the IPO book-building process in the Spanish capital market, the pricing can be thought of as occurring in three stages. First, the firm and its underwriters agree on a range of prices within which they expect to set the offer price. This price range is listed in a prospectus that is filed with the CNMV. The second stage of the pricing process typically occurs after the market closes on the day before the offering, when the company and its underwriters set the final offer price. This is the price at which the issue is offered to the public. Finally, when the issue starts trading we observe the market´s assessment of the value of the firm.
For the other three methods, the process is not the same. In fixed price public offers, the price is already set in the prospectus that is filed within the CNMV. In consequence, there are only two stages and there is no uncertainty for investors about the value of the shares.
With this method, the firm does not include in the offer price the information obtained during the IPO process because this price is set previously.
In private offers, the price is set after the negotiation between the firm and the private investor, which is typically an institutional investor or an investor with high economic power; consequently, there is no uncertainty for the private investor/s about the value of the shares. Usually this method is cheaper for the firm in term of costs and also for investors in terms of the final offer price. Finally, with direct entry, a method by which admission is requested to quote shares that are in the hands of the shareholders, the price setting is not a relevant question, so we cannot discuss its efficiency in these terms because there is not a previous offer.
For each firm, the price update (VARP), is calculated as the percentage change between the midpoint of the initial price range and the offer price, when possible The initial return (IR) is the percentage change between the offer price and the first closing price. The average IR is 12,21% for firms going public in the Spanish capital market, as we can see in Table 1a. As discussed earlier, this analysis of the effects of public information on the pricing of IPOs begins at the time the initial price range is set. We first examine the relation between the firm-level price update and both firm- and deal-specific characteristics and various measures of market returns. This analysis reveals whether or not investment bankers incorporate all available information into the initial price range (Section 3). In addition, it also sheds light on the extent to which public information that becomes available during the filing period is incorporated into the offer price. Section 4 of the paper investigates this second point in more depth. Specifically, that section focuses on the relation between initial returns and market returns during the registration period, after controlling for the same firm- and deal-specific characteristics.
The variables that represent firm- and deal-specific characteristics consist of information available in the preliminary prospectus, and are compiled in Table 2.
For each firm, we identify the lead underwriter and assign an underwriter rank (RANK), based on its experience on the IPO market for the period of study. Underwriters are ranked from 0 to 3, with higher number representing higher quality.
At the same time, we calculate the sector with the CNAE 93 code3. Using this classification system, we also assign each firm a technology dummy (TECH), equal to one if the firm is in a technology industry and zero otherwise. To capture the effects of firm size, we collect data on total assets before the offering (TA) and proceeds filed (PROCEEDS). Proceeds filed equals the midpoint of the initial price range (or the price set in the prospectus, when there is no price range) multiplied by the number of shares filed.
To adjust for inflation, TA and proceeds are converted to 1985 currency using the gross national product deflator, and they are then transformed using logarithms to reduce skewness. We also consider return on investments (ROI) as a measurement of firm return;
alternatively we include ROE (return on equity) and AGE, the age of firm at the moment to go public, to check the robustness of the results. We consider the differences in the valuation, taking into account for each firm the method to go public: direct entry (DIRECT), private offer (PRIVATE), fixed-price public offers (FIXED-PRICE) and book- building offers (BOOK-BUILDING). We include dummy variables for each method and we also repeat the estimations for the different subsamples.
It is important to look at the relation between firm-level information and the price update, but also to examine the effects of marketwide public information. Specifically, we examine the effects of a measure of “market return” (MKT) which is the return on the Madrid Stock
3 This is a sectorial classification of Spanish firms.
Exchange Index over the period between the filing date and the offer date for each firm in the sample.
In order to investigate the possibility that positive and negative information learned during the registration period affect the offer price differently, we define two asymmetry measures. First, VARP+ equals VARP when the price update is positive, and zero otherwise. Similarly, MKT+ equals MKT when the market return during the registration period is positive, and zero otherwise. Thus, in the cross-sectional regression models, the coefficients on these variables measure the differences between the effects of positive versus negative information, if any.
We also include control variables for the type of allocation. The current assignation methods are proportional (PROPOR), chronological order (CHRONOL) and discretionary (DISCRET). The analysis to explain how IPO prices are updated between the initial prospectus and the final offer, and how does the aftermarket price of the stock relate to the offer price is shown in the following section.
3. Explanation of IPO pricing and differences with other methods to go public
In the Spanish capital market the pricing of an IPO begins at the time the IPO is filed, and thus the analysis of the pricing process is begun at this point. In book-building offers, the preliminary price range should provide some information about how underwriters expect to price the offering. In fact, much prior literature has used the midpoint of this initial range as an estimate of the expected offer price. The use of this midpoint price as an unbiased predictor of the final offer price assumes that underwriters incorporate all available information in setting the preliminary price range. However, sometimes this might not be the case. For example, according to some people, investment bankers deliberately set the price range low, with the hope of generating momentum and thereby increasing demand
for the offering. Yet many investment banks deny that this is the case, and Loughran and Ritter (2002) also provide some evidence against this explanation. In addition, Daniel (2002) shows that initial returns are significantly related to market returns up to three moths before the offering. He notes that this finding, combined with the fact that registration periods average approximately two moths, suggests that price updates are predictable. Registration periods in the Spanish capital market average approximately between one and two months.
The objective of this section is to investigate whether or not the midpoint of the price range actually represents an unbiased estimate of the final offer price. In Spain, registration periods average approximately between one and two months. The first thing to note about the price update is that it is positive on average, 0,649% for the hole sample, being statistically different from zero. However there are differences according to the type of offer: the average price update for public offers is 1,225% (3,558% for book-building offers and 0,058% for fixed price offers) while private offers show an average price update of 0,783%. Thus the price is about 0,7% over the midpoint of the initial filing range, on average, but it is even higher for public offers, specially those following the book-building method, which are the more recent ones.
Now it is necessary to examine the extent to which underwriters incorporate available information about the company at the time they set the initial filing range. In addition, we also provide some evidence on how underwriters treat information that becomes available during the filing period. Specifically, the following aspects are examined: marketwide information that becomes available before the setting of the price range, also marketwide information that becomes available during the filing period and the effects of firm- and deal-specific characteristics.
3.1. The price range in the initial prospectus
In order to investigate underwriters´ treatment of marketwide information, we would ideally like to examine market returns immediately before the first release of the price range. Except for direct entries, we consider the date of the first prospectus in the database.
In most part of the cases, the initial prospectus included the initial price range.
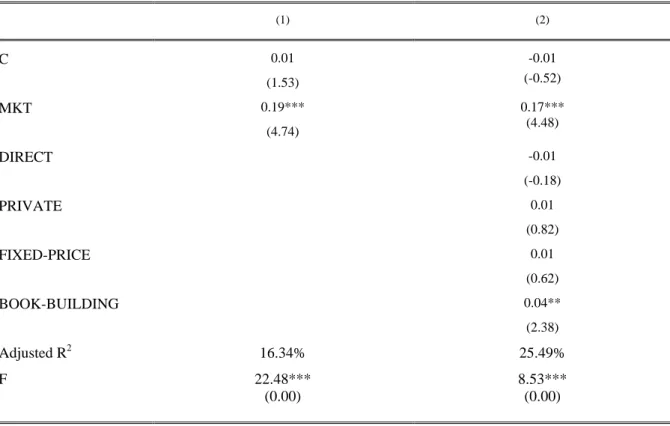
The OLS regressions of the price update for the 111 firms that went public between 1985 and 1997, in the Spanish capital market are shown in Table 3. The market return (MKT) is measured between the release of the initial price range, and the setting of the offer price, which is assumed to be one day before the IPO. One of the estimations includes dummy variables depending on the method to go public (DIRECT, PRIVATE, FIXED-PRICE, BOOK-BUILDING). These variables take the value of 1 if the method to go public is each one of the previous methods, and 0 otherwise. Because MKT represents public information learned between the setting of the initial price range and the final offer price, we expect MKT to be strongly related to the price update.
Looking at the first regression at Table 3, we can see that the coefficient on MKT is positive and statistically significant at 1% level. This coefficient on MKT seems to suggest that public information released between the filing date and the offer date is not fully incorporated into the ultimate offer price. It seems that underwriters do not fully incorporate all available public information.
The second column of Table 3 examines the robustness of these results, including dummy variables for each type of method to go public in the Spanish capital market. As we can see, only the book-building process is positive and significantly related to the price update and the adjusted R2 is 25,49%. This fact shows the difference in the price update for each
type of method to go public, because it seems relevant in the case of the book-building process but not in the other cases.
3.2 . The price update and the treatment of public information
The effects of market returns before the setting of the initial price range are examined directly in Table 4a and we consider market returns before the filing date. In addition, Table 4a also investigates the effects of firm- and deal-specific characteristics and the effects of market returns between the filing date and the offer date. The model estimated by OLS is the following:
VARPi = α + β1. RANKi + β2. TECHi + β3. TAi + β4. ROAi + β5. PROCEEDSi + β6. DISCRETi + β7. PROPORi + β8. CHRONOLi + β9. MKTi + β10. MKT+i + Σ βk + 10. WKki + ξi
k= 1, …5.
The variables for the firm- and deal-specific characteristics were defined in Section 2 and are compiled in Table 2. The effects of market returns (MKT) both before and after the offering are also considered. In other regressions the variable MKT+ is included, allowing for an asymmetric reaction of price updates to market returns because it is possible that underwriters treat positive information learned during the filing period differently than they treat negative information. Additionally, WKk represents the market return for the kth week immediately before the filing date, where each week represents five trading days. For example, WK1 represents returns over the five trading days before the filing date, and WK2 represents returns over the 6th-10th trading days before the filing date.
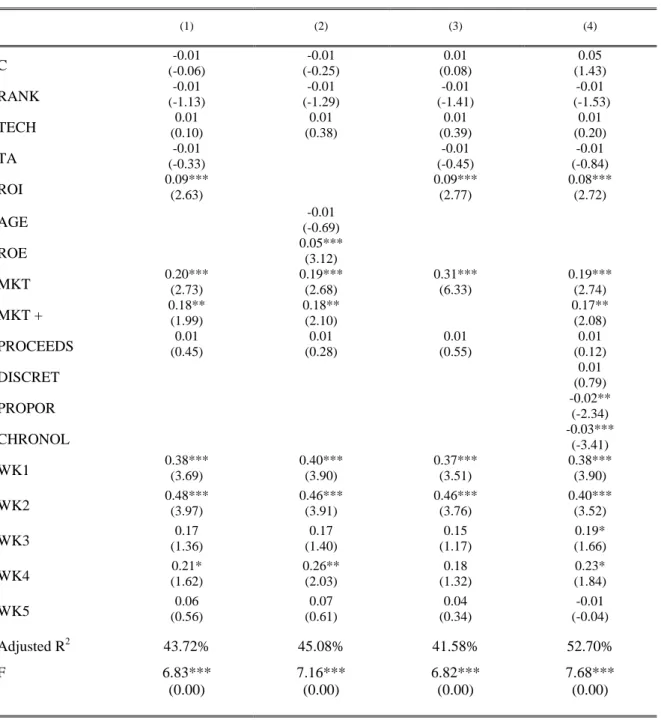
Column 1 shows a regression of the price update on the firm- and deal-specific characteristics, MKT, MKT+, and WK1 through WK5. Column 2, the same but substituting TA and ROA by AGE and ROE, respectively. Column 3, is the same as column 1, but
without MKT+. Last column is the initial regression including dummy variables for the type of allocation.
We find that only the return on investments (ROI) predicts the price update for the shares of the firms that go public. The same happens with the alternative variable ROE (column 2). On the contrary, the firm´s size, the sector or the underwriter´s rank are not related to the price update. This suggests that banks that are more reputable are not more nor less conservative in setting the initial price range, considering all the firms in the sample.
Moreover, underwriter´s reputation is not relevant for the pricing of the firms that go public. This could be explained by the tradition of the Spanish underwriters, which was not very important at the moment of the period of study.
On the other hand, technology firms do not tend to have higher price updates than the rest of firms. This suggests that investment banks in Spain do not set the filing range of riskier firms lower; they do not try to protect themselves in the event that the firm ends up being worth less than they had forecast. The result for the variable PROCEEDS suggests that there is no relation between the offer size and the price update. The effects of market returns both before and after the offering are particularly interesting.
A variety of information is likely to be revealed between the time the initial price range is set and when the final offer price is decided. Some of this information, such as the general state of the overall economy, will be reflected in market returns. Thus, we would expect the price update to be related to market returns during the filing period. Consistent with this intuition, Loughran and Ritter (2002) find that the price update is significantly related to the CRSP value-weighted return during the 15 days before the offering. We examine this relation in more depth to better understand how public information that becomes available before the initial offer affects the final offer price. For example, we examine the
date. We note that there is no obvious reason that the price update should be related to market returns before the initial registration date. In fact, this would indicate that available public information is not fully incorporated into the price range by underwriters
The results in Table 4a are consistent with the results in Table 3. Market returns during the filing period are significantly positively related to the price update at 1% level (t-statistic of 2,73). However, market returns before the filing are also significantly positively related to the price update. An F-test that the coefficients on WK1 through WK5 equal zero is rejected at the 10% level. This result suggests that underwriters do not fully incorporate all available information when they set the initial price range. Why do the underwriter and issuing firm disregard so much publicly available information?. One potential explanation is that in some cases, the parties implicitly agree on the initial price range before it is publicly released in the preliminary prospectus. The results are consistent with a scenario in which the parties agree to the price range approximately one month before the filing.
It is interesting to see that just as the coefficients on WK1 through WK5 indicate that public information released before the filing is not always fully incorporated into the filing range, the coefficient on MKT seems to suggest that public information released between the filing and the offering is not always fully incorporated into the ultimate offer price.
Viewing the coefficient on MKT as an average β of the IPO firms and assuming that IPO firms are more risky than an average firm, one would expect this coefficient estimate to be greater than one. However, we obtain an estimate of 0,31 (column 3). It seems that the offer price is adjusted less than one-for-one with overall movements in market values in the months before the IPO. In contrast, Ibbotson (1975), Clarkson and Thompson (1990), and Chan and Lakonishok (1992) find that the β of IPOs shortly after going public is greater than two, and Ritter and Welch (2000) obtain a β estimate of approximately 1,7.
If IPO firms in Spain have similar risk levels before the actual offer, then the low β estimates in Tables 3 and 4a suggest that the price update represents only a partial adjustment to the public information reflected in market returns. Such a finding would be inconsistent with Benveniste and Spindt´s model (1989). An alternative interpretation of the low β estimates is that they reflect the lack of trading in these pre-IPO stocks (Gintschel, 2000).
The difference between column 1 and column 3 is only the variable MKT+. This is to investigate the relation between market returns during the filing period and the price update in more depth. Specifically, Column 1 allows for an asymmetric reaction of price updates to market returns. It is possible that underwriters treat positive information learned during the filing period differently than they treat negative information. Thus, we include both MKT and MKT+, where MKT+ equals MKT when MKT is positive and zero otherwise. The coefficient on MKT is 0,20 (t-statistic of 2,73) in Column 1, implying that a market return of –10% results in a price update of -2,0%. In contrast, the coefficient on MKT+ is +0,18 (t-statistic of 1,99), implying that a market return of +10% results in a price update of +3,8% (0,20 + 0,18).
Consequently, negative information learned during the filing period results in a lower offer price (–2%); bad systematic news appear to cause the offer prices of firms in registration to fall. This adjustment of price updates to negative information most likely reflects the fact that neither the issuing firm nor the underwriter wants the IPO to be overpriced and therefore unattractive to investors. The finding that offer prices are revised for 3,8% when market prices increase is puzzling.
It is important to ask why the underwriter and issuing firm agree to incorporate such a small portion of this positive information into the offer price. Edelen and Kadlec (2002)
that firms are more likely to withdraw their offerings following negative market returns.
They estimate a probit model for offer withdrawal, then use the estimated probability to help explain the price update using the method of Heckman (1979). Not surprisingly, the relation between negative market returns and the price update is weaker, presumably because much of the effect of negative market returns is encompassed in the probability of withdrawal. However, it remains puzzling that offer prices are revised relatively little when market returns are positive. Finally, the last column of Table 4a examines the robustness of these results, including control variables for the different types of allocation.
We can see that there is a negative and statistically significant relation between the price update and the proportional and chronological order allocations, while there is no impact of the discretionary allocation.
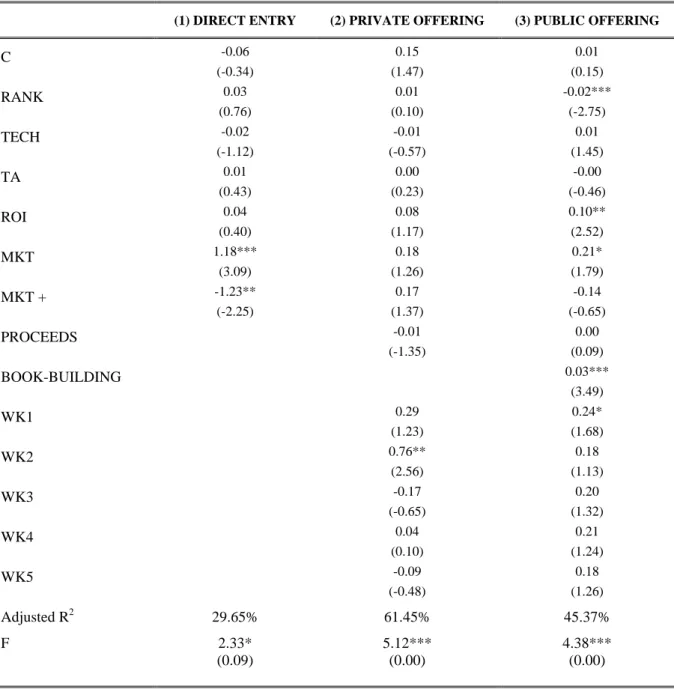
In Table 4b, we repeat the estimation of Column 1 (Table 4a), in order to see the differences according to the method to go public in the Spanish capital market. For the direct entry (column 1) only the market return is statistically significant and there are no previous offer. In private offerings (column 2) this variable is not relevant, because the price of the offer is the result of an agreement between the firm and the institutional investor/s. In this type of offer the stocks are sold directly to a little group of institutional investors. This type of offer can be much cheaper than public offers.
Finally, with the initial public offerings (IPOs), the availability of the model is higher. The rank of the underwriter is statistically significant. The role of the underwriter is important in this type of offers. The ROI is also relevant, and the coefficient on MKT is 0,21 (t- statistic of 1,79), implying that a market return of –10% results in a price update of -2,1 %.
In contrast, the coefficient on MKT+ is -0,14, but it is not statistically significant. As expected, negative information learned during the filing period results in a lower offer price. This adjustment reflects the fact that neither the issuing firm nor the underwriter
wants the IPO to be overpriced, and therefore unattractive to investors. In contrast, the finding that offer prices are not revised significantly when market prices increase is puzzling, as we have argumented before.
We also include BOOK-BUILDING, as a dummy variable for this type of offer and it is statistically significant at 1% level. This result indicates that the price update is relevant when this method is used, in relation the information learned during the IPO process, which is different from the fixed-price method and from the private offering and the direct method. Finally, only the market return in the first week before the filing is statistically significant. This result suggests that underwriters do not fully incorporate all available information during that week when they set the initial price range.
4. The initial returns and the price update
In the previous section, tables 3, 4a and 4b showed that the price update is predictably related to some of the information contained in the preliminary prospectus and to market returns before the filing. The process of updating the price of the issuing firm´s stock takes another large step when the IPO occurs. This section investigates the extent to which public information learned during the registration period is incorporated into the offer price. If such information is entirely incorporated into the final offer price, then it should have no power to explain initial returns. Benveniste and Spindt´s (1989) model provides a rational explanation for why private information should be only partially incorporated into the offer price. However, Loughran and Ritter (2002) propose a prospect theory explanation, which predicts that both public and private information will be only partially incorporated into the offer price, and they find evidence consistent with this theory.
Notably, their findings are inconsistent with Benveniste and Spindt´s model.
When the underwriters and the IPO firm go on the road show before the offering, in the case of the IPO firms with the book-building method, they presumably have two main objectives. They wish to market the issue to potential investors, and they seek to obtain more information on the true value of the firm. To the extent that this new information is incorporated into the offer price, it contributes to a more accurate pricing of the new issue.
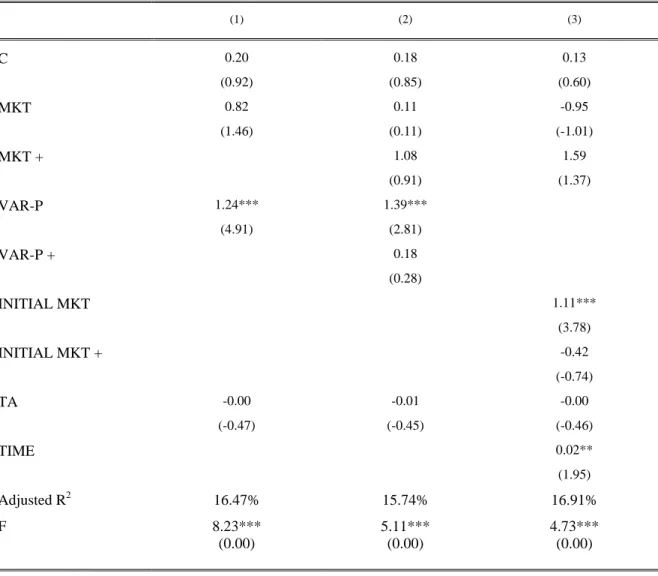
Note that if such information were entirely incorporated into the offer price, then it would not be related to the initial return. Table 5 examines the extent to which the information learned during the registration period, the market returns, the price update and the time elapsed between the filing and the initial day of trading, are reliably related to the initial return, using OLS estimations.
Column 1 of Table 5 includes TA, as a measure of firm-specific variable, controlling for size and two measures of the information that becomes available during the registration period, MKT and VARP. Column 2 shows the same regression but including the variables MKT+ and VARP+, which are dummy variables that take the value of 1 when MKT and VARP are positive and 0 otherwise. Assuming that underwriters employ both public and private information learned during the registration period to arrive at the ultimate offer price, the price update (VARP) should incorporate both types of information. In contrast, MKT should only reflect public information. As we include both of these variables in one regression, to the extent that MKT captures the effects of public information on the initial return, the coefficient of VARP should isolate the effects of private information. As shown in Table 5, only private information is significantly positive (t-statistic of 4,91 for VARP).
The variable MKT do not reach the conventional levels of significance. This seems to suggest that underwriters only partially incorporate private information; on the contrary, the public information that they learn during the registration period seems to be included
into the offer price. Consequently, private information contributes significantly to the initial return.
Column 2 allows for an asymmetric effect in the initial return regressions. Specifically, MKT+ and VARP+ are added to the regression. None of them is statistically significant.
Consequently, we find no asymmetric effect between positive and negative information.
Last column includes, as a control variable, the INITIAL MKT, which is the market return in the initial day of trading. We also include INITIAL MKT+ to allow for an asymmetric effect between positive and negative information. The TIME elapsed between the filing and the initial day of trading is also considered. As we can observe, both INITIAL MKT and TIME are statistically significant; the result for INITIAL MKT+ shows that there is no asymmetric effect between positive and negative market returns. The time elapsed between the filing period and the initial day of trading is directly related to the initial underpricing, showing that the institutional lag have a direct connection with the initial return on stocks.
In summary, the lack of statistical significance of MKT and MKT+ and the statistical significance of VARP in Table 5 indicates that underwriters do not fully incorporate private information into the offer price, but they do seem to incorporate public information.
But how much private information are they really disregarding?.
In order to shed light on this issue, we estimate the economic impact of the price update on initial returns. The regressions in Table 5 show that an 7,7% change in the price update during the filing period (approximately a one standard deviation change) is associated with a 9,5% change in initial returns (approximately a 0,47 standard deviation). Thus, the economic significance of the price update appears quite important. Thus, private information learned during the filing period has a much greater effect on the initial return than public information, because the coefficient of this last variable is not statistically
significant. While underwriters seem to systematically omit much private information from the offer price, it seems that they incorporate the vast majority of public information.
In summary, the price update during the filing period is a statistically significant predictor of initial returns; moreover, their economic significance is quite important in the Spanish IPO market. This important economic significance is consistent with Benveniste and Spindt (1989) and suggests that underwriters fully incorporate most public information. In contrast, the high statistical and economic significance of the price update indicates that they only partially incorporate private information. It must be taken into account that Benveniste and Spindt provide a rational incentive-based explanation for underwriters only partially incorporating private information, but similar theories do not hold for public information. This is consistent in the context of the Spanish capital market.
In relation to prior literature, the results are not consistent with Loughran and Ritter (2002) that estimate regressions of the initial return on market returns during the 15 days before the IPO, and they find that initial returns are significantly related to these market returns.
In the multiple regressions in this paper, this effect is not statistically and economically significant, as we have explained before.
5. Conclusions
The aim of this paper is to analyze the efficiency of the pricing process of firms that went public on Madrid Stock Exchange during the period 1985-1997. Results show that underwriters do not fully incorporate all the available information. The result that public information is not fully incorporated into the initial price range is relevant. Both prior market returns and some of the firm- and deal-specific characteristics are significantly related to the price update. This finding does not necessarily imply a market inefficiency, however. Investors cannot buy shares at the filing prices, so the predictability of the price
update does not represent a profit opportunity, nor is it a cost for the issuing firm.
However, this finding does have implications for future research. Most of the prior literature has assumed that the midpoint of the preliminary price range is an unbiased predictor of the final offer price. In this case, this paper provides an evidence on the validity of this assumption, for the Spanish capital market.
On the other hand, we find that underwriters similarly disregard some private information when they set the final offer price. Moreover, the effect of this private information on initial returns is quite important in economic terms. It seems that underwriters incorporate the vast majority of public information into the final offer price, which is consistent with the predictions of Benveniste and Spindt (1989). By definition, public information is available to everyone, including the underwriter. Therefore, the underwriter does not need to reward any group of investors for providing this information, such as by enabling them to reap abnormal gains on the IPO firm´s first day of trading. In Spain, the institutional investor is not benefited for the information given during the IPO process, and this information is included into the final offer price. On the contrary, retail investors that have access to public information, are benefited in the final price at which they buy the shares, frequently cheaper than the price for institutional investors.
In summary, there are reliable statistical relations between private information and underwriter´s pricing of the issue at various stages, and these relations are also significant in economic terms. Thus, underwriters´ treatment of private information appears to be consistent with an efficient IPO pricing process at the semistrong form in the Spanish capital market.
References
Álvarez, S. (2001): “Las salidas a bolsa en España: características y rentabilidades iniciales” Cuadernos de Economía y Dirección de la Empresa (CEDE), 9, 303- 325.
Álvarez, S., González, V. (2005): “Signalling and the Long-run Performance of Spanish Initial Public Offerings (IPOs)” Journal of Business Finance and Accounting, 32, (1-2; January / March), 325-350.
Benveniste, L., Spindt, P. (1989): “How Investment Bankers Determine The Offer Price and Allocation of New Issues”. Journal of Financial Economics, 24, 343-361.
Chan, L., Lakonishok, J. (1992): “Robust measurement of beta risk”. Journal of Financial and Quantitative Analysis, 27, 265-282.
Clarkson, P., Thompson, R. (1990): “Empirical Estimates of Beta When Investors Face Estimation Risk”. The Journal of Finance, 45, nº 2, 431-453.
Daniel, K. (2002): “Discussion of “Why don´t issuers get upset about leaving money on the table on IPOs?”. Review of Financial Studies, 15, 445-454.
Edelen, R., Kadlec, G. (2002): “Comparable firm returns, issuer surplus, and the pricing and withdrawal of IPOs”. Working paper, University of Pennsylvania, Philadelphia, PA.
Farinós, J.E. (2001): “Rendimientos anormales de las OPV en España”. Investigaciones Económicas, XXV (2), 417-437.
Fernández, P.; Martínez-Abascal, E. and Rahnema, A. (1993): “Initial Public Offerings (IPOs): The Spanish Experience”. Working paper, no. 243, IESE, University of Navarra.
Freixas, X., Inurrieta, A. (1991): “Infravaloración en las salidas a bolsa”. Working paper, no. 91-21, FEDEA, Madrid.
Gintschel, A. (2000): “The relation between quote revisions and market returns in the absence of trade”. Working paper, University of Rochester, Rochester, NY.
Heckman, J. (1979): “Sample selection bias as a specification error”. Econometrica, 47,153-161.
Ibbotson, R. (1975): “Price Performance of Common Stock New Issues”. Journal of Financial Economics, 2, 235-272.
Loughran, T., Ritter J. (2002): “Why don´t issuers get upset about leaving money on the table on IPOs?”. Review of Financial Studies, 15, 413-443.
Ritter, J. (1984): “The “Hot Issue” Market of 1980”. Journal of Business, 57, 215- 240.
Ritter, J. (1991): “The Long-Run Performance of Initial Public Offerings”. The Journal of Finance, 46, no. 1, 3-28.
Ritter, J., Welch, I. (2000): “A review of IPO activity, pricing, and allocations”. Journal of Finance, 57, 1795-1828.
Table 1a. Characteristics of the sample
The table presents the characteristics of the 111 firms that went public on Madrid Stock Exchange between 1985 and 1997. Both the size of the offering and the size of the firm are expressed in millions of pesetas. The age of the firm, understood as the time passed since its foundation until the moment of its listing on the stock exchange, is expressed in years.
Mean Median Maximum Minimum Standard Deviation
Size of the offering 10,161 2,466 148,213 0 23,959
Size of the firm (total assets) 76,309 5,455 5,700,405 0.34 538,438
ROI in year –1 (%) 11.62 9.09 39.35 -1.51 0.10
ROE in year –1 (%) 29.99 22.01 304.72 -13.80 0.27
Investment rate in year –1 (%) 70.25 8.28 3,356.05 -82.69 3.74 Growth in sales in year –1 (%) 35.06 16.33 5,442.17 -67.59 0.77
Age of the firm 30 22 115 0.08 24.06
Market-to-book ratio 6.06 3.88 48.22 -39.40 8.90
Initial underpricing (%) 12.21 4.35 1,300 -39.29 0.27
Table 1b.- Method to go public and allotment formulae*
METHOD to GO PUBLIC → ALLOTMENT FORMULA
↓
Initial Public Offering (IPO)
Private Placement
Direct
Proportional 26 2 0
Chronological Order 34 30 20
Discretionary 12 0 0
* One method to go public may use one or more allotment formulae combined together in the same offer.
Table 2. Model and variables used in the analysis
The estimated model used is the following:
VARPi = α + β1. RANKi + β2. TECHi + β3. TAi + β4. ROIi + β5. PROCEEDSi + β6. DISCRETi + β7. PROPORi + β8. CHRONOLi + β9. MKTi + β10. MKT+i + Σ βk + 10. WKki + ξi
k= 1, …5.
And the variables employed being those described in the table.
DEPENDENT VARIABLES
VARP: Percentage change between the midpoint of the initial price range and the offer price.
IR: Percentage change between the offer price and the first closing price.
INDEPENDENT VARIABLES
RANK: Variable ranked from 0 to 3, with higher number representing higher quality of the underwriter, according to the experience.
TECH: Technology dummy, equal to one if the firm is in a technology industry and zero otherwise.
TA: Logarithm of the total assets at the moment of going public, converted to 1985 currency.
ROI: Return on investments at the moment of going public.
AGE: Logarithm of the firm’s age at the moment of going public.
ROE: Return on equity at the moment of going public.
PROCEEDS: Logarithm of the proceeds filed equal to the midpoint of the initial price range multiplied by the number of shares filed, converted to 1985 currency.
DIRECT: Dummy variable that takes the value 1 if the placement is direct, and 0 otherwise.
PRIVATE: Dummy variable that takes the value 1 if the placement is private, and 0 otherwise.
FIXED-PRICE: Dummy variable that takes the value 1 if the placement is a fixed-price public offer, and 0 otherwise.
BOOK-BUILDING: Dummy variable that takes the value 1 if the placement is a book-building public offer, and 0 otherwise.
MKT: Return on the Madrid Stock Exchange Index over the period between the filing date and the offer date for each firm in the sample.
MKT+: Variable that equals MKT when the market return during the registration period is positive, and zero otherwise.
VARP +: Variable that equals VARP when the price update is positive, and zero otherwise.
WK k (k = 1…5): Market return for the kth week immediately before the filing date, where each week represents five trading days.
INITIAL MKT: Return on the Madrid Stock Exchange Index in the initial day of trading.
INITIAL MKT+: Variable that equals INITIAL MKT when the market return during the initial day of trading is positive, and zero otherwise.
TIME: Number of days elapsed between the filing and the initial day of trading.
CONTROL VARIABLES
DISCRET: Dummy variable that takes the value 1 if the current assignation method is discretionary, and 0 otherwise.
PROPOR: Dummy variable that takes the value 1 if the current assignation method is proportional, and 0 otherwise.
CHRONOL: Dummy variable that takes the value 1 if the current assignation method is by chronological order, and 0 otherwise.
TABLE 3. Price updates and public information
The values in the table are the results of the regression models for the percentage change between the middle of the range of prices in the initial registration statement and the offer price, VARP, using data of the 111 firms that started quoting on the Madrid Stock Exchange between 1985 and 1997. The independent variables are described in Table 2.
(1) (2)
C 0.01
(1.53)
-0.01 (-0.52)
MKT 0.19***
(4.74)
0.17***
(4.48)
DIRECT -0.01
(-0.18)
PRIVATE 0.01
(0.82)
FIXED-PRICE 0.01
(0.62)
BOOK-BUILDING 0.04**
(2.38)
Adjusted R2 16.34% 25.49%
F 22.48***
(0.00)
8.53***
(0.00)
*** Significant at 1%; ** Significant at 5%; * Significant at 10%.
TABLE 4a. Relation of price updates to public and firm information
The values in the table are the results of the regression models for the percentage change between the middle of the range of prices in the initial registration statement and the offer price, VARP, using data of the 111 firms that started quoting on Madrid Stock Exchange between 1985 and 1997. The independent variables are described in Table 2.
(1) (2) (3) (4)
C (-0.06) -0.01 (-0.25) -0.01 (0.08) 0.01 (1.43) 0.05 RANK (-1.13) -0.01 (-1.29) -0.01 (-1.41) -0.01 (-1.53) -0.01 TECH (0.10) 0.01 (0.38) 0.01 (0.39) 0.01 (0.20) 0.01
TA (-0.33) -0.01 (-0.45) -0.01 (-0.84) -0.01
ROI 0.09*** (2.63) 0.09*** (2.77) 0.08*** (2.72)
AGE (-0.69) -0.01
ROE 0.05*** (3.12)
MKT 0.20*** (2.73) 0.19*** (2.68) 0.31*** (6.33) 0.19*** (2.74)
MKT + 0.18** (1.99) 0.18** (2.10) 0.17** (2.08)
PROCEEDS (0.45) 0.01 (0.28) 0.01 (0.55)0.01 (0.12) 0.01
DISCRET (0.79) 0.01
PROPOR -0.02** (-2.34)
CHRONOL -0.03*** (-3.41)
WK1 0.38*** (3.69) 0.40*** (3.90) 0.37*** (3.51) 0.38*** (3.90) WK2 0.48*** (3.97) 0.46*** (3.91) 0.46*** (3.76) 0.40*** (3.52)
WK3 (1.36)0.17 (1.40)0.17 (1.17)0.15 (1.66)0.19*
WK4 (1.62)0.21* 0.26** (2.03) (1.32)0.18 (1.84)0.23*
WK5 (0.56)0.06 (0.61)0.07 (0.34)0.04 (-0.04)-0.01
Adjusted R2 43.72% 45.08% 41.58% 52.70%
F 6.83***
(0.00)
7.16***
(0.00)
6.82***
(0.00)
7.68***
(0.00)
*** Significant at 1%; ** Significant at 5%; * Significant at 10%.
F test that the coefficients on WK1 to WK5 are different from zero F
(p-value)
2.12*
(0.07)
TABLE 4b. Relation of price updates to public and firm information depending on the type of offer
The values in the table are the results of the regression models (separated by the type of offer) for the percentage change between the middle of the range of prices in the initial registration statement and the offer price, VARP, using data of the 111 firms that started quoting on Madrid Stock Exchange between 1985 and 1997. The independent variables are described in Table 2.
(1) DIRECT ENTRY (2) PRIVATE OFFERING (3) PUBLIC OFFERING
C -0.06
(-0.34)
0.15 (1.47)
0.01 (0.15)
RANK 0.03
(0.76)
0.01 (0.10)
-0.02***
(-2.75)
TECH -0.02
(-1.12)
-0.01 (-0.57)
0.01 (1.45)
TA 0.01
(0.43)
0.00 (0.23)
-0.00 (-0.46)
ROI 0.04
(0.40)
0.08 (1.17)
0.10**
(2.52)
MKT 1.18***
(3.09)
0.18 (1.26)
0.21*
(1.79)
MKT + -1.23**
(-2.25)
0.17 (1.37)
-0.14 (-0.65)
PROCEEDS -0.01
(-1.35)
0.00 (0.09)
BOOK-BUILDING 0.03***
(3.49)
WK1 0.29
(1.23)
0.24*
(1.68)
WK2 0.76**
(2.56)
0.18 (1.13)
WK3 -0.17
(-0.65)
0.20 (1.32)
WK4 0.04
(0.10)
0.21 (1.24)
WK5 -0.09
(-0.48)
0.18 (1.26)
Adjusted R2 29.65% 61.45% 45.37%
F 2.33*
(0.09)
5.12***
(0.00)
4.38***
(0.00)
*** Significant at 1%; ** Significant at 5%; * Significant at 10%.
TABLE 5. Relation of initial underpricing to price update and public and firm information
The values in the table are the results of the regression models for the initial underpricing, using data of the 111 firms that started quoting on Madrid Stock Exchange between 1985 and 1997 following the book-building method. The independent variables are described in Table 2.
(1) (2) (3)
C 0.20
(0.92)
0.18 (0.85)
0.13 (0.60)
MKT 0.82
(1.46)
0.11 (0.11)
-0.95 (-1.01)
MKT + 1.08
(0.91)
1.59 (1.37)
VAR-P 1.24***
(4.91)
1.39***
(2.81)
VAR-P + 0.18
(0.28)
INITIAL MKT 1.11***
(3.78)
INITIAL MKT + -0.42
(-0.74)
TA -0.00
(-0.47)
-0.01 (-0.45)
-0.00 (-0.46)
TIME 0.02**
(1.95)
Adjusted R2 16.47% 15.74% 16.91%
F 8.23***
(0.00)
5.11***
(0.00)
4.73***
(0.00)
*** Significant at 1%; ** Significant at 5%; * Significant at 10%.
F
UNDACIÓN DE LASC
AJAS DEA
HORROS DOCUMENTOS DE TRABAJOÚltimos números publicados
159/2000 Participación privada en la construcción y explotación de carreteras de peaje Ginés de Rus, Manuel Romero y Lourdes Trujillo
160/2000 Errores y posibles soluciones en la aplicación del Value at Risk Mariano González Sánchez
161/2000 Tax neutrality on saving assets. The spahish case before and after the tax reform Cristina Ruza y de Paz-Curbera
162/2000 Private rates of return to human capital in Spain: new evidence F. Barceinas, J. Oliver-Alonso, J.L. Raymond y J.L. Roig-Sabaté 163/2000 El control interno del riesgo. Una propuesta de sistema de límites
riesgo neutral
Mariano González Sánchez
164/2001 La evolución de las políticas de gasto de las Administraciones Públicas en los años 90 Alfonso Utrilla de la Hoz y Carmen Pérez Esparrells
165/2001 Bank cost efficiency and output specification Emili Tortosa-Ausina
166/2001 Recent trends in Spanish income distribution: A robust picture of falling income inequality Josep Oliver-Alonso, Xavier Ramos y José Luis Raymond-Bara
167/2001 Efectos redistributivos y sobre el bienestar social del tratamiento de las cargas familiares en el nuevo IRPF
Nuria Badenes Plá, Julio López Laborda, Jorge Onrubia Fernández
168/2001 The Effects of Bank Debt on Financial Structure of Small and Medium Firms in some Euro- pean Countries
Mónica Melle-Hernández
169/2001 La política de cohesión de la UE ampliada: la perspectiva de España Ismael Sanz Labrador
170/2002 Riesgo de liquidez de Mercado Mariano González Sánchez
171/2002 Los costes de administración para el afiliado en los sistemas de pensiones basados en cuentas de capitalización individual: medida y comparación internacional.
José Enrique Devesa Carpio, Rosa Rodríguez Barrera, Carlos Vidal Meliá
172/2002 La encuesta continua de presupuestos familiares (1985-1996): descripción, representatividad y propuestas de metodología para la explotación de la información de los ingresos y el gasto.
Llorenc Pou, Joaquín Alegre