Altered clot kinetics in patients
with non-alcoholic fatty liver disease
Ingrid J. Hickman,*,1 Clair M. Sullivan,*,,1 Simone Flight, Catherine Campbell,§ Darrell H. Crawford,,|| Paul P. Masci, Trisha M. OMoore Sullivan,*, Johannes B. Prins,*,¶ Graeme A. Macdonald*, ||
1 These authors contributed equally
*The Diamantina Institute for Cancer, Immunology and Metabolic Medicine, The University of Queensland. The University of Queensland School of Medicine; and
the Departments of Diabetes and Endocrinology, § Pathology, and || Gastroenterology and Hepatology. ¶ Centres for Health Research, Princess Alexandra Hospital, Brisbane, Australia.
ABSTRACT
Background. Emerging evidence has linked the presence of non-alcoholic fatty liver disease (NAFLD) with an increased risk for cardiovascular events. We hypothesised that altered clot kinetics and platelet func-tion may contribute to this increased risk. This study compared whole blood clotting kinetics in patients with 1) non-cirrhotic NAFLD (n = 28) and 2) healthy control subjects (n = 22). Methods. Clotting kinetics were assessed in whole blood using thromboelastography (TEG) and assessed for correlations with cardio-vascular risk factors. Results. Clot kinetics in patients with NAFLD showed significantly stronger clot deve-lopment (maximum amplitude (MA); 58.3 ± 6.3 mm vs. 52.0 ± 10.1 mm, p = 0.01) and reduced clot lysis in the presence of thrombin (35 ± 30% vs. 51 ± 26% clot lysis 30 minutes after MA, p = 0.03) compared to control subjects. Clot strength was independently positively associated with body mass index in NAFLD, but not in control subjects. There was a greater platelet contribution to clot strength in patients with NAFLD com-pared to controls despite similar platelet counts. There was no association between clot kinetics and fea-tures of the metabolic syndrome or presence of type 2 diabetes. Conclusion. Patients with NAFLD have disturbances in ex-vivo clot kinetics including increased clot strength and clots that are more resistant to thrombin-stimulated lysis.
Key words.Obesity. Platelets. Thrombosis. Chronic liver disease. NASH. Thromboelastography.
Correspondence and reprint request: Dr. Ingrid Hickman
Diamantina Institute for Cancer Immunology and Metabolic Medicine. Level 3, R Wing, Princess Alexandra Hospital. Ipswich Rd, Woolloongabba, Brisbane QLD 4102, Australia.
Tel.: +61 7 3240-2804 Fax: +61 7 3240-2973 E-mail: [email protected]
Manuscript receive: September 19, 2009. Manuscript accepted: October 20, 2009. INTRODUCTION
Nonalcoholic fatty liver disease (NAFLD) is asso-ciated with central obesity, type 2 diabetes and the metabolic syndrome, all recognised risk factors for cardiovascular disease (CVD). There is emerging evi-dence that CVD mortality poses a greater risk than liver-related death in patients with NAFLD.1,2 These data are supported by a number of cross-sectional studies which link measures of endothelial dysfunc-tion to visceral obesity, insulin resistance and
featu-res of the metabolic syndrome in patients with NA-FLD.3-10 It has been proposed that increased risk of CVD events may be independent of classical CVD risk factors and other prognostic risk factors.11,12
there was a history of haematological, vascular or clotting disorders; or there was evidence of decom-pensated liver disease. NAFLD was diagnosed on the basis of liver histology (n 18), or raised liver enzymes and a hepatic ultrasound consistent with steatosis. Other causes of liver disease were exclu-ded on history and serologically. The control pa-tients had normal liver enzymes (ALT < 35U/L; AST < 35 U/L; GGT < 55U/L), no evidence of liver disease (serologically or on history), no hepatome-galy on clinical examination and did not have the metabolic syndrome (MS) as defined by the Interna-tional Diabetes Federation Criteria.29 They were fre-quency matched to the NAFLD group on age and gender. Anthropometric data (height, weight, waist circumference) were collected using standard techni-ques and Body Mass Index (BMI) was calculated in kg/m2.
Phlebotomy
Blood was collected after a 10 hour overnight fast. TEG analysis was performed on 10 millilitres of blood that had been collected into 3.2% citrate tubes30 and processed within 6 hours of collection.
Analysis of whole blood clotting and lysis using Thromboelastography
Thromboelastography was performed using a Thrombelastograph® (TEG®, Haemscope Corpora-tion, Niles, IL, USA). The basic principles of throm-Insulin resistance is strongly associated with
in-creased platelet reactivity, a procoagulant phenoty-pe and increased platelet adherence after vascular injury.16-18 Large epidemiological studies have co-rrelated insulin and proinsulin levels with coagula-tion factors and fibrinogen.19,20 Obesity is associated with an impaired fibrinolytic response to thrombosis which results in exaggerated and persistent throm-bosis21 and is also associated with platelet hyperac-tivity and resistance to anti-aggregating effects of insulin, aspirin, prostacyclin and nitric oxide.22
Some plasma haemostatic factors which favour atherosclerosis have been shown to correlate with hepatic steatosis including PAI-1 and Factor VII ac-tivity (F-VIIc).23 However, there is a paucity of data on clot kinetics in NAFLD. Traditional clotting tests (prothrombin time, activated partial thrombo-plastin time) are limited because they are performed on plasma, rather than whole blood, and the contri-bution of platelets is not assessed. An alternative to these studies is thromboelastography (TEG). Thromboelastography is well established in liver transplantation.24-26 The test is typically performed intraoperatively, and the results determine which phase of coagulation/fibrinolysis is predominating during the surgery. TEG can evaluate whole blood clot dynamics and clot tensile properties and has re-cently been shown to accurately predict post-opera-tive myocardial infarcts.27,28
We hypothesise that abnormalities in clotting ki-netics exist in patients with NAFLD and are asso-ciated with obesity-related metabolic dysfunction. The aim of this study was to investigate whole blood kinetics in patients with NAFLD in comparison to healthy controls and to determine if changes to hae-mostatic factors are associated with obesity-related metabolic factors and/or histological features of li-ver disease.
METHODS
Patient selection
The study had approval from the Human Resear-ch Ethics Committee of the Princess Alexandra Hos-pital and the University of Queensland and informed written consent was obtained from participants. Two groups were recruited from the community and outpatient hospital clinics and included patients with NAFLD (n 28) and lean, apparently healthy controls (n 22). Participants were excluded if there was any history of anticoagulation therapy or other medications known to affect platelet function;
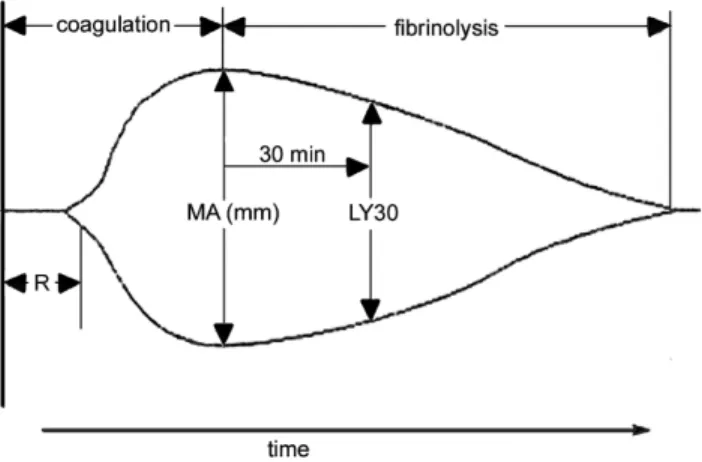
Figure 1. A representative labelled thromboelastograph
boelastography have been described by Ludding-ton.27 Clotting is initiated by the addition of calcium to a sample of whole blood. The reaction time (R) is the time taken for a clot to begin forming and is es-tablished when the trace amplitude reaches 2 mm (Figure 1). The amplitude (A) is a measure of the clot strength (shear modulus). Maximum amplitude (MA) from the TEG® tracing, representing clot strength, was recorded for each patient. MA is a di-rect function of the maximum dynamic properties of fibrin and platelet bonding via GPIIb/IIIa and repre-sents the ultimate strength of the fibrin clot. The percentage of clot lysis 30 minutes after the MA is established is the LY30 value. These parameters are labelled on a representative TEG trace (Figure 1). The co-efficient of variation (CV) of MA in our labo-ratory is approximately 5%.
For each patient three separate tests were perfor-med in duplicate. Each test used 320 µL of citrated whole blood and 20 µL of 0.2 M CaCl2. The first was a baseline test which analysed clotting by recalcifi-cation of citrated blood. The second was a thrombin/ t-PA test which assesses fibrinolysis and directly ac-tivates fibrinogen and platelets (via thrombin recep-tors) with 1 IU of thrombin (Sigma Aldrich, MO, USA). Fibrinolysis was assessed by the addition of 35 IU of t-PA (Boehringer Ingelheim, Ingelheim, Germany) to the citrated blood sample. The third test assessed the contribution of platelets to clot strength by the addition of 5 µL of abciximab (Eli Lilly, NSW, Australia) to recalcified blood. Abcixi-mab binds to the glycoprotein IIb/IIIa receptor of human platelets, inhibiting platelet aggregation the-refore allowing the measurement of a clot strength which develops without platelet involvement.
The baseline recalcification studies and abciximab tests were monitored until the MA was established, while the thrombin/t-PA tests were stopped 30 minu-tes after MA was reached when LY30 could be mea-sured. The platelet contribution to clot strength was calculated by subtracting the MA with abciximab from the baseline MA with recalcification.31
Biochemical analyses
Glucose was analysed with an automated Hitachi 747-100 analyser (Roche, Dee Why, New South Wales, Australia). Insulin was assayed using an im-munoenzymometric assay with fluorescence detec-tion using the Tosoh AIA-600 analyser (South San Francisco, CA, USA). Insulin sensitivity was calcu-lated using the homeostatic model of assessment of insulin resistance (HOMA-IR).32,33 Total cholesterol,
HDL-cholesterol and triglycerides were assayed by an enzymatic colorimetric assay with Roche Modu-lar Chemistry Analyser (South San Francisco, CA, USA). LDL-cholesterol was determined using the Friedewald equation.34
Histological Analysis of liver biopsy
Liver biopsy specimens were fixed in 10% neutral buffered formalin and embedded in paraffin. Steato-sis was graded as follows: 1, (5-30% of hepatocytes affected); 2, (30-70% of hepatocytes affected); or 3, (> 70% of hepatocytes affected). The severity of liver injury was assessed using the NAFLD activity score (NAS).35 A diagnosis of non-alcoholic steatohepati-tis (NASH) was defined as NAS ≥ 5.35
STATISTICAL ANALYSIS
Continuous, normally distributed variables were summarized as mean ± standard deviation (SD). Va-riables that were not normally distributed were log transformed prior to analysis. Differences in the means of variables between the control group and patients with NAFLD were assessed using indepen-dent unpaired t-tests. The degree of association bet-ween continuous variables was assessed using
Table 1. Clinical characteristics of control subjects and pa-tients with NAFLD
Variables Lean Control NAFLD n = 22 n = 28
Gender; n (M/F) 10 / 12 16 / 12 Age (yrs) 48 ± 14 48 ± 10 BMI (kg/m2) 23.3 ± 1.6 35.7 ± 8.2***
Waist (cm) 83 ± 7 113 ± 18***
SBP (mmHg) 123 ± 20 125 ± 15 DBP (mmHg) 77 ± 11 82 ± 11 ALT (U/L) 21 ± 9 53 ± 25***
AST (U/L) 24 ± 7 35 ± 13***
GGT (U/L) 24 ± 14 78 ± 69***
Glucose (mmol/L) 4.8 ± 0.5 6.2 ± 2.1**
HDL (mmol/L) 1.9 ± 0.5 1.3 ± 0.5***
Insulin (mU/L) 6 ± 3 21 ± 16***
HOMA-IR 1.18 ± 0.61 5.68 ± 3.99***
LDL (mmol/L) 2.4 ± 0.7 2.4 ± 1.3 Triglyceride (mmol/L) 0.9 ± 0.3 2.6 ± 3.4**
Prothrombin Time (sec) 10.3 ± 0.7 10.3 ± 0.7 aPTT (sec) 28.7 ± 5.5 30.9 ± 7.2 Platelet count 225 ± 60 251 ± 90 Fibrinogen (mg/dL) 2.87 ± 0.46 3.59 ± 0.73***
Type 2 diabetes n (%) 0 9 (32) Metabolic Syndrome n (%) 0 17 (59)
Pearsons correlation coefficient (r) or Spearmans rank order correlation (rs). Linear regression was performed for multivariate analysis. All analysis was carried out using SPSS software version 14.0 (SPSS Inc. Chicago, IL, USA). Statistical significance was taken at a level of 5%.
RESULTS
Twenty-eight patients with NAFLD were similar in age and gender distribution to the 22 control sub-jects. Patient characteristics are shown in Table 1. Nine NAFLD patients had type 2 diabetes and 17 (59%) had the MS. Serum fibrinogen was significant-ly higher in NAFLD compared to controls. Pro-thrombin time was within the normal range for all participants and there was no difference in platelet count between NAFLD and control subjects (Table 1, p 0.30).
Whole blood clot kinetics in NAFLD
Compared to controls, clot kinetics were signifi-cantly altered in patients with NAFLD, with greater clot strength (MA; 58.3 ± 6.3 mm vs. 52.0 ± 10.1 mm, p 0.01; Figure 2) and reduced clot lysis (35 ± 30% vs. 51 ± 26% clot lysis 30 minutes after MA in the presence of t-PA, p 0.03; Figure 3). The pre-sence of type 2 diabetes or the metabolic syndrome had no impact on clot strength (p 0.24 and p 0.57 respectively) or lysis (p 0.48 and p 0.24 respectively) in NAFLD patients.
There was no change in clot strength (p 0.86) or lysis time (p 0.96) across increasing grades of steatosis in patients with NAFLD, nor were there differences in these parameters in patients with
Figure 2. Greater clot strength in patients with NAFLD
compared to lean control subjects. **p=0.01 compared to lean controls.
Clot
Strength
(maximum
amplitude)
75
50
25
0
Control NAFLD
Figure 3. Significantly less clot lysis occurred 30 minutes after the maximum amplitude was reached in patients with NAFLD compared to lean control subjects. *p = 0.03.
Clot Lysis (%)
60
50
40
30
20
Control NAFLD
(n 7) and without (n 11) NASH in the 18 pa-tients who underwent liver biopsy (p 0.55 and p 0.97 respectively).
MA was significantly associated with BMI in pa-tients with NAFLD (r 0.55, p 0.002) but not in controls (p 0.15). In patients with NAFLD, MA was significantly correlated with waist circumferen-ce (r 0.45, p 0.02) but not with other features of the metabolic syndrome, including systolic (p 0.70) and diastolic (p 0.83) blood pressure, fasting gluco-se (p 0.58), HDL cholesterol (p 0.35) or trigly-cerides (p 0.63).
There was a strong positive relationship between plasma fibrinogen and MA in controls (r 0.62, p 0.004) and a multivariate regression analysis which included age, gender and fibrinogen explained 53% of the variation in MA in lean subjects (R2 0.532, p 0.01). In patients with NAFLD, adding BMI to this same model explained 52% of the variation in MA and BMI maintained a strong unique contribu-tion to the variacontribu-tion in MA in addicontribu-tion to that of fibrinogen (BMI ß 0.47, p 0.005; fibrinogen ß 0.47, p 0.005). This independent effect of BMI on MA in NAFLD, above that of increased fibrino-gen, could not be statistically explained by any BMI-related CVD risk factor such as blood pressure, HDL cholesterol or triglycerides when they were se-parately added to the multivariate regression model. Clot lysis was not correlated with individual fea-tures of the metabolic syndrome in either controls or patients with NAFLD.
multiva-riate analysis corrected for age, gender, waist cir-cumference and the presence or absence of diabetes (ß 0.51, p 0.02).
Platelet contribution to clotting
When the platelet contribution to clot develop-ment was attenuated by the addition of abciximab, MA was not different between the control and NA-FLD groups (MA abciximab 18.7 ± 4.7 mm vs. 19.6 ± 5.6 mm respectively; p 0.43) suggesting diffe-rences in platelet activity may be responsible for the variation in MA seen between control subjects and patients with NAFLD during baseline TEG measure-ments.
Platelet contribution to clot strength can be cal-culated as a function of maximum amplitude of clot formation in the TEG (MA recalcification-MA
ab-Clot Lysis (%)
100
75
50
25
0
0 1 2 3 4 5 6
Fibrinogen (mg/dL)
Figure 4A and B. Positive relationship between clot lysis
and serum fibrinogen in patients with NAFLD (rs = 0.52, p = 0.006) but not in lean controls (p = 0.96).
Clot Lysis (%)
100
75
50
25
0
0 1 2 3 4 5 6
Fibrinogen (mg/dL)
ciximab). Clots from patients with NAFLD showed a greater platelet contribution to MA than those from controls (38.7 ± 5.2 mm vs. 33.4 ± 7.8 mm, p 0.006; Figure 5).
The contribution of platelets to clot strength was positively associated with waist circumference in NAFLD (rs 0.49, p 0.01). However, this relatio-nship was not seen in controls (p 0.26). Platelet contribution to clot strength was not associated with individual features of the metabolic syndrome, and not affected by the presence or absence of the metabolic syndrome in NAFLD (p 0.58).
DISCUSSION
Patients with NAFLD have disturbances in ex vivo clot kinetics when compared to healthy controls including increased clot strength and slower clot ly-sis in the presence of t-PA. Altered clot kinetics in NAFLD were not related to the severity of liver in-jury in this study population but rather to the degree of obesity. This relationship between clot kinetics and NAFLD appears to be related to changes in pla-telet function and is independent of classical cardio-vascular risk factors which occur in the setting of obesity such as features of the metabolic syndrome.
In advanced liver disease there are increased blee-ding tendencies. However, the data from the current study demonstrate that prior to the onset of cirrho-sis, patients with NAFLD are hypercoaguable, have hyperactive platelets and may be at risk of thrombo-tic disorders in the event of induced clotting activity such as surgery, injury or atherosclerotic disease.
Fibrinogen is likely to explain a significant pro-portion of clot strength as measured by TEG maxi-mum amplitude (MA). However, in patients with NAFLD, there was an additional independent effect
Figure 5. Greater platelet contribution to maximum
am-plitude in NAFLD compared to lean controls. **p < 0.01.
Platelet
contribution
to
maximum
amplitude
(mm)
40
30
20
10
Control NAFLD
A: Control
of BMI on this measurement of clot strength above that of fibrinogen which was not explained by any of the classical metabolic risk factors measured in this cohort. It has previously been demonstrated that platelet activity and lipid composition is influenced by the lipid composition of the milieu.36 Excess flow of free fatty acids arising from dysfunctional/insulin resistant adipose tissue in patients with NAFLD may have played a role in our observations.37 Inter-estingly, in the NAFLD group, fibrinogen was also positively associated with clot lysis; the higher the fibrinogen, the more effective the clot lysis. This may reflect the physiologic parallel increase in lysis with a prothrombotic state which is mediated by proteins such as thrombin-activatable fibrinolysis inhibitor (TAFI).38 This positive association of fibri-nogen with lysis was not seen in controls suggesting that there may be alternative activation of lysis par-ticular to NAFLD.
We found evidence that platelets play a role in linking obesity with increased clot strength in NA-FLD however this was not due to differences in pla-telet count. When the plapla-telet contribution to clots was removed with abciximab, clot strength was not different between NAFLD and controls.
The tendency for platelets to hyper-aggregate is thought to be due to sensitivity of platelets to acti-vation induced by collagen and ADP. With central obesity there is a reduced ability of cyclic nucleoti-des to inhibit platelet aggregation.39 The thrombin-induced platelet activation, which is a major step in the coagulation cascade, is enhanced by VLDL and LDL, whilst HDL inhibits this thrombin-induced ac-tivation process.40 Patients with triglyceride rich particles in plasma show marked increase in mar-kers of platelet activation such as P-selectin and CD63, in vivo.41
There were no trends to indicate that changes in TEG measured clot kinetics were associated with his-tological severity of liver injury. This is in keeping with studies that show NAFLD has increased cardio-vascular risk compared to other liver diseases with equivalent liver injury such as chronic HCV,42,43 and suggests that increased cardiovascular risk in NA-FLD is due to an obesity-related metabolic dysfunc-tion rather than liver injury itself. While our data demonstrates a strong effect of BMI on clotting kine-tics, it did not identify an additional independent effect of the classical CVD risk factors on clot streng-th or lysis. This is in keeping wistreng-th recent reports of independent effects of NAFLD on CVD12 and more sophisticated measures of insulin resistance and/or inflammation may be necessary to explore further.
A possible mechanism linking obesity and clot ki-netics is changes to other prothrombotic cytokines such as PAI-1 and hs-CRP.12 These were not measu-red in the current study but have been demonstrated to be increased in obesity and NAFLD.4,44 Pro-thrombotic PAI-1 is produced by visceral adipocytes and are closely associated with visceral adiposity in NAFLD4 and is also linked to the severity of steato-sis and insulin resteato-sistance in humans and in mouse models of obesity.44 In addition, its association with the metabolic syndrome and type 2 diabetes45 makes PAI-1 an interesting area for the further investiga-tion into its potential effects on clotting kinetics in NAFLD.
Under normal conditions (lean healthy people), insulin is an antithrombotic agent, however in obe-sity, these actions are impaired. Insulin can have a direct effect on stimulating coagulation factors and fibrinogen and insulin receptors are found on plate-lets.46 Insulin at physiological doses attenuates cru-cial steps in arterial thrombus formation, including the inhibition of platelet-collagen and subsequent platelet-platelet interactions in healthy subjects.47 These antithrombotic effects are defective in obesity and could provide a mechanism linking insulin re-sistance to atherothrombotic vascular disease.47 The NAFLD cohort had significant hyperinsulinemia which may contribute to changes in platelet func-tion during clotting and lysis.
A weakness of this study is that no patient in the control group had a liver biopsy to exclude undetec-ted steatosis however, our inclusion criteria requi-red all controls to have normal liver enzymes, no hepatomegaly and no metabolic syndrome therefore reducing the risk for hepatic steatosis. It is unethi-cal to perform liver biopsy for research purposes on patients at low risk for liver disease. The effect of undetected steatosis in the control group would be to weaken any detectable differences between groups in the study.
In conclusion, the current study shows that clots are stronger overall, and slower to lyse in patients with NAFLD. This may contribute to increased CVD risk. Changes to clot kinetics are strongly linked with obesity but are independent of the classical obe-sity-related cardiovascular risk factors associated with the metabolic syndrome and therefore alternati-ve mechanistic pathways should be explored.
ACKNOWLEDGEMENTS
Trabi, Dr. Goce Dimeski, Ms. Connie Salona and Ms. Victoria Byrnes during the course of the study.
ABBREVIATIONS
CVD: Cardiovascular disease.
NAFLD: Non-alcoholic fatty liver disease.
BMI: Body mass index.
PAI-1: Plasminogen activator inhibitor-1.
TEG: Thromboelastograph.
HOMA-IR: Homeostatic model of assessment Insulin resistance.
NASH: Non-alcoholic steatohepatitis.
MA: Maximum amplitude.
LY30: Percent lysis after 30 mins.
HDL: high density lipoprotein.
ALT: Alanine transaminase.
HCV: Hepatitis C virus.
FINANCIAL SUPPORT
IH is funded by a National Health and Medical Research Council (NHMRC) Australian Clinical Re-search Fellowship. CS is funded by a Pfizer Cardio-vascular Lipid Fellowship and a Diabetes Australia Research Trust Grant. A proportion of patients in-cluded in this study were recruited from a large cli-nical intervention study funded through the NHMRC Centre for Clinical Research Excellence (CCRE), Brisbane, Australia.
REFERENCES
1. Adams LA, Lymp JF, St Sauver J, et al. The natural history of nonalcoholic fatty liver disease: a population-based co-hort study. Gastroenterology 2005; 129: 113-21.
2. Ekstedt M, Franzen LE, Mathiesen UL, et al. Long-term fo-llow-up of patients with NAFLD and elevated liver enzy-mes. Hepatology 2006; 44: 865-73.
3. Targher G, Bertolini L, Padovani R, Zenari L, Zoppini G, Fa-lezza G. Relation of nonalcoholic hepatic steatosis to early carotid atherosclerosis in healthy men: role of visceral fat accumulation. Diabetes Care 2004; 27: 2498-500.
4. Targher G, Bertolini L, Scala L, Zoppini G, Zenari L, Falez-za G. Non-alcoholic hepatic steatosis and its relation to increased plasma biomarkers of inflammation and endo-thelial dysfunction in non-diabetic men. Role of visceral adipose tissue. Diabet Med 2005; 22: 1354-8.
5. Targher G, Bertolini L, Padovani R, et al. Increased prevalence of cardiovascular disease in Type 2 diabetic patients with non-alcoholic fatty liver disease. Diabet Med 2006; 23: 403-9. 6. Targher G, Bertolini L, Padovani R, et al. Non-alcoholic
fatty liver disease is associated with carotid artery wall thickness in diet-controlled type 2 diabetic patients. J En-docrinol Invest 2006; 29: 55-60.
7. Volzke H, Robinson DM, Kleine V, et al. Hepatic steatosis is associated with an increased risk of carotid atherosclero-sis. World J Gastroenterol 2005; 11: 1848-53.
8. Targher G, Bertolini L, Padovani R, et al. Relations bet-ween carotid artery wall thickness and liver histology in subjects with nonalcoholic fatty liver disease. Diabetes Care 2006; 29: 1325-30.
9. OLeary DH, Polak JF, Kronmal RA, et al. Distribution and correlates of sonographically detected carotid artery di-sease in the Cardiovascular Health Study. The CHS Colla-borative Research Group. Stroke 1992; 23: 1752-60. 10. Villanova N, Moscatiello S, Ramilli S, et al. Endothelial
dys-function and cardiovascular risk profile in nonalcoholic fatty liver disease. Hepatology 2005; 42: 473-80.
11. Targher G, Arcaro G. Non-alcoholic fatty liver disease and increased risk of cardiovascular disease. Atherosclerosis
2007; 191: 235-40.
12. Targher G, Marra F, Marchesini G. Increased risk of car-diovascular disease in non-alcoholic fatty liver disease: causal effect or epiphenomenon? Diabetologia 2008; 51: 1947-53.
13. Lisman T, Bongers TN, Adelmeijer J, et al. Elevated levels of von Willebrand Factor in cirrhosis support platelet ad-hesion despite reduced functional capacity. Hepatology
2006; 44: 53-61.
14. Tripodi A, Primignani M, Chantarangkul V, et al. An imba-lance of pro- vs Anti-coagulation factors in plasma from patients with cirrhosis. Gastroenterology 2009; In press. 15. Northup PG, Sundaram V, Fallon MB, et al.
Hypercoagula-tion and thrombophilia in liver disease. JThromb Haemost
2008; 6: 2-9.
16. Sobel BE, Schneider DJ. Platelet function, coagulopathy, and impaired fibrinolysis in diabetes. Cardiol Clin 2004; 22: 511-26.
17. Trovati M, Anfossi G. Influence of insulin and of insulin re-sistance on platelet and vascular smooth muscle cell func-tion. Journal of Diabetes and its Complications 2002; 16: 35-40.
18. Anfossi G, Trovati M. Pathophysiology of platelet resistance to anti-aggregating agents in insulin resistance and type 2 diabetes: implications for anti-aggregating therapy. Car-diovasc Hematol Agents Med Chem 2006; 4: 111-28. 19. Meigs JB, Mittleman MA, Nathan DM, et al.
Hyperinsuline-mia, hyperglyceHyperinsuline-mia, and impaired hemostasis: the Fra-mingham Offspring Study. JAMA 2000; 283: 221-8. 20. Haffner SM, DAgostino R. Jr., Mykkanen L, et al. Insulin
sensitivity in subjects with type 2 diabetes. Relationship to cardiovascular risk factors: the Insulin Resistance Atherosclerosis Study. Diabetes Care 1999; 22: 562-8. 21. Sola E, Vaya A, Contreras T, et al. Rheological profile in
se-vere and morbid obesity. Preliminary results. Clin Hemor-heol Microcirc 2004; 30: 415-8.
22. Anfossi G, Russo I, Massucco P, et al. Impaired synthesis and action of antiaggregating cyclic nucleotides in plate-lets from obese subjects: possible role in platelet hyperac-tivation in obesity. Eur J Clin Invest 2004; 34: 482-9. 23. Cigolini M, Targher G, Agostino G, Tonoli M, Muggeo M, De
Sandre G. Liver steatosis and its relation to plasma hae-mostatic factors in apparently healthy men-role of the me-tabolic syndrome. Thromb Haemost 1996; 76: 69-73. 24. Gillies BS. Thromboelastography and liver transplantation.
Semin Thromb Hemost 1995; 21(Suppl 4): 45-9.
25. Ramsay MA, Randall HB, Burton EC. Intravascular thrombosis and thromboembolism during liver transplantation: antifibri-nolytic therapy implicated? LiverTranspl 2004; 10: 310-4. 26. Di Benedetto P, Baciarello M, Cabetti L, Martucci M,
Chiaschi A, Bertini L. Thrombelastography. Present and fu-ture perspectives in clinical practice. Minerva Anestesiol
27. Luddington RJ. Thrombelastography/thromboelastometry.
Clin LabHaematol 2005; 27: 81-90.
28. McCrath DJ, Cerboni E, Frumento RJ, Hirsh AL, Bennett-Guerrero E. Thromboelastography maximum amplitude pre-dicts postoperative thrombotic complications including myocardial infarction. Anesth Analg 2005; 100: 1576-83. 29. The IDF consensus worldwide definition of the metabolic
syndrome. 2005. (Accessed 14 Feb, 2007, at http:// www.idf.org/webdata/docs/MetSyndrome_FINAL.pdf.) 30. Zambruni A, Thalheimer U, Leandro G, Perry D, Burroughs
AK. Thromboelastography with citrated blood: comparabi-lity with native blood, stabicomparabi-lity of citrate storage and effect of repeted sampling. Blood Coagul Fibrinolysis
2004; 15: 103-7.
31. Gottumukkala VN, Sharma SK, Philip J. Assessing platelet and fibrinogen contribution to clot strength using modi-fied thromboelastography in pregnant women. Anesth Analg 1999; 89: 1453-5.
32. Matthews DR, Hosker JP, Rudenski AS, Naylor BA, Trea-cher DF, Turner RC. Homeostasis model assessment: insu-lin resistance and beta-cell function from fasting plasma glucose and insulin concentrations in man. Diabetologia
1985; 28: 412-9.
33. Levy JC, Matthews DR, Hermans MP. Correct homeostasis model assessment (HOMA) evaluation uses the computer program. Diabetes Care 1998; 21: 2191-2.
34. Friedewald WT, Levy RI, Fredrickson DS. Estimation of the concentration of low-density lipoprotein cholesterol in plasma, without use of the preparative ultracentrifuge.
Clin Chem 1972; 18: 499-502.
35. Kleiner DE, Brunt EM, Van Natta M, et al. Design and vali-dation of a histological scoring system for nonalcoholic fatty liver disease. Hepatology 2005; 41: 1313-21. 36. Shattil SJ, Anaya-Galindo R, Bennett J, Colman RW, Cooper
RA. Platelet hypersensitivity induced by cholesterol incor-poration. J Clin Invest 1975; 55: 636-43.
37. Cusi K. Role of insulin resistance and lipotoxicity in non-al-coholic steatohepatitis. Clin Liver Dis 2009; 13: 545-63. 38. Bouma BN, Marx PF, Mosnier LO, Meijers JC.
Thrombin-acti-vatable fibrinolysis inhibitor (TAFI, plasma procarboxypep-tidase B, procarboxypepprocarboxypep-tidase R, procarboxypepprocarboxypep-tidase U).
Thromb Res 2001; 101: 329-54.
39. Russo I, Del Mese P, Doronzo G, et al. Platelet resistance to the antiaggregatory cyclic nucleotides in central obesi-ty involves reduced phosphorylation of vasodilator-stimu-lated phosphoprotein. Clin Chem 2007; 53: 1053-60. 40. Aviram M, Brook JG. Characterization of the effect of
plasma lipoproteins on platelet function in vitro. Haemos-tasis 1983; 13: 344-50.
41. Yamazaki M, Uchiyama S, Xiong Y, Nakano T, Nakamura T, Iwata M. Effect of remnant-like particle on shear-induced platelet activation and its inhibition by antiplatelet agents. Thromb Res 2005; 115: 211-8.
42. Targher G, Bertolini L, Padovani R, Rodella S, Arcaro G, Day C. Differences and similarities in early atherosclerosis between patients with non-alcoholic steatohepatitis and chronic hepatitis B and C. J Hepatol 2007; 46(6): 1126-32. 43. Sanyal AJ, Banas C, Sargeant C, et al. Similarities and diffe-rences in outcomes of cirrhosis due to nonalcoholic steato-hepatitis and steato-hepatitis C. Hepatology 2006; 43: 682-9. 44. Alessi MC, Bastelica D, Mavri A, et al. Plasma PAI-1 levels
are more strongly related to liver steatosis than to adipo-se tissue accumulation. Arterioscler Thromb Vasc Biol
2003; 23: 1262-8.
45. Kohler HP, Grant PJ. Plasminogen-activator inhibitor type 1 and coronary artery disease. N Engl J Med 2000; 342: 1792-801.
46. Kohler HP. Insulin resistance syndrome: interaction with coa-gulation and fibrinolysis. Swiss Med Wkly 2002; 132: 241-52. 47. Trovati M, Anfossi G. Influence of insulin and of insulin