Rapid determination of salbutamol in pharmaceutical preparations by chiral capillary electrophoresis
7
0
0
Texto completo
(2) [17]. Finally, a fast enantiomeric separation, in about 2 min, of salbutamol using a neutral b-CD derivative (permethylated b-CD) or a negatively charged b-CD derivative (carboxymethyl-b-CD) as chiral selector was performed recently by our research team [18]. The main objective of this work was the application of the fast and simple chiral CE method developed by our research team for the chiral separation of salbutamol [18] to the determination of this compound in different pharmaceutical preparations where it was used as a racemate. Furthermore, since there is no information concerning the unstability of one enantiomer of salbutamol with respect to the other one in pharmaceutical formulations, the evaluation of the stability of these enantiomers in an oral solution was also performed.. Determination of salbutamol by chiral CE. Table 1. Composition of the different pharmaceutical preparations studied in this work Pharmaceutical Composition preparation Syrup (A). Salbutamol sulfate, sodium saccharine and excipients (sodium citrate, citric acid monohydrate, hydroxypropylmethylcellulose, sodium benzoate, orange flavor, sodium chloride, and purified water). Syrup (B). Salbutamol sulfate and excipients (sodium benzoate, hypromelose, sodium saccharine, citric acid, sodium citrate, orange flavor, and purified water). Oral solution (C) Salbutamol sulfate and excipients (sodium benzoate, citric acid monohydrate, sodium saccharine, sodium citrate, sodium chloride, aroma of raspberry, and water) Tablet (D). Salbutamol sulfate and excipients (corn starch, polyvinylpyrrolidone, cellulose, sodium starch caboxymethylated, silicium dioxide, talc, magnesium estearate). Tablet (E). Salbutamol sulfate and excipients (sodium chloride, povidone, sodium croscarmellosa, silicagel, magnesium estearate, cellulose acetate, methylhydroxypropylcellulose, titanium dioxide, hydroxypropylcellulose, lacas rubber, industrial methylated spirit, 2-etoxyiethanol, n-butyl alcohol, aluminium laca of lipstick, and polydimethylsiloxano). 2 Materials and methods 2.1 Chemicals and samples All reagents were of analytical grade. Dimethyl sulfoxide (DMSO), and sodium hydroxide were supplied from Merck (Darmstadt, Germany); hydrochloric acid was purchased from Panreac (Barcelona, Spain); CM-b-CD (degree of substitution 3) was obtained from Cyclolab (Budapest, Hungary). Water used to prepare solutions was purified through a Milli-Q system from Millipore (Bedford, MA, USA). All solutions were filtered through 45 mm pore size disposable nylon filters from Scientific Resources (Eatontown, NJ, USA). Salbutamol was purchased from Sigma (St. Louis, MO, USA). The structure of the enantiomers of this basic drug is shown in Fig. 1. Different pharmaceutical preparations containing salbutamol sulfate were acquired in pharmacy shops at Alcalá de Henares (Madrid, Spain). Table 1 shows the composition of the different pharmaceutical preparations studied in this work.. 2681. 2.2 Apparatus An HP3D CE system (Hewlett-Packard, Waldbronn, Germany) equipped with an on-column diode array detector (DAD) and an HP 3D-CE Chemstation software was used. An uncoated fused-silica capillary from Composite Metal Services (Worcester, England) with 50 mm inner diameter (ID) and 375 mm outer diameter (OD) with an effective length of 25 cm (33.5 cm total length) was employed. Capillary temperature was set to 257C and UV detection was performed at 230 nm. Separation voltage was 20 kV. Electrolytic solutions were degassed in an ultrasonic bath KM from Raypa (Barcelona, Spain). A 654 pH meter from Metrohm (Herisau, Switzerland) was employed to adjust the pH of the separation buffer.. 2.3 Procedure. Figure 1. Structure of the enantiomers of salbutamol.. Electrolytic solutions were prepared weighing and dissolving the appropriate amount of buffer and CM-b-CD in Milli-Q water to obtain the required concentration and. CE and CEC. Electrophoresis 2003, 24, 2680–2686.
(3) 2682. E. Ekiert et al.. Electrophoresis 2003, 24, 2680–2686. 2.4 Data treatment All the experimental data were manipulated using Excel 7.0 from Microsoft Office software [19]. Regression analysis, analysis of variance (ANOVA) and comparison of regression lines for significantly different slopes and intercepts were made using Statgraphics Plus software [20].. 3 Results and discussion 3.1 Separation of the enantiomers of salbutamol in different pharmaceutical preparations. Figure 2. Separation of salbutamol enantiomers in a standard solution (0.045 mg/mL) and in dilutions of the five pharmaceutical preparations studied in this work (0.045 mg/mL in salbutamol) using the chiral CE method. Experimental conditions: 25 mM acetate buffer (pH 5) with 13.1 mg/mL CM-b-CD; temperature, 257C; applied voltage, 20 kV; UV detection at 230 nm; injection by pressure, 30 mbar for 2 s sample followed by 30 mbar for 2 s buffer; 50 mm ID, 375 mm OD capillary of 33.5 cm length (25 cm to the detector).. adjusting the pH to the desired value with a 1 M hydrochloric acid solution and 0.1 M sodium hydroxide. Standard solutions of salbutamol used for the calibration by the external standard method were prepared by diluting with DMSO a stock solution of 10 mg/mL of salbutamol in DMSO to obtain final concentrations comprised from 0.005 to 0.120 mg/mL (0.005, 0.010, 0.020, 0.030, 0.045, 0.060, 0.080, 0.100, and 0.120 mg/mL). The determination of the salbutamol content in the different pharmaceutical preparations (two syrups, an oral solution, and two tablets) required a dilution of each formulation in a final volume of DMSO to achieve a final concentration of 0.015 mg/mL in salbutamol. For the calibration by the standard additions method, three increasing concentrations of salbutamol standard (0.010, 0.030, and 0.060 mg/mL) were added to a solution of the pharmaceutical preparation with a concentration of 0.015 mg/ mL of salbutamol. The four resulting solutions were directly injected in the electrophoretic system. Nevertheless, in the case of the tablets it was necessary to include a centrifugation step to separate the insoluble excipients from the solution before the injection of the solution in the CE system. Between injections, the capillary was washed with 0.1 M sodium hydroxide (10 bar for 0.2 min), followed by the running buffer (10 bar for 0.4 min). The injection was made by pressure: 30 mbar for 2 s of sample followed by 30 mbar for 2 s of separation buffer.. In a previous work it was reported that the fast enantiomeric separation of salbutamol, in about 2 min is possible, using 25 mM acetate buffer (pH 5) containing 13.1 mg/mL CM-b-CD at a temperature of 257C and an applied voltage of 20 kV in a capillary of 25 cm of effective length [18]. These conditions have been applied in this work to the fast chiral analysis of salbutamol in different pharmaceutical preparations: two syrups, an oral solution, and two kind of tablets. Figure 2 shows the electropherograms corresponding to a standard solution of salbutamol (0.045 mg/mL) and to five dilutions in DMSO of the different pharmaceutical preparations studied containing 0.045 mg/mL of salbutamol sulfate. It was observed that a mixture of the two enantiomers of salbutamol was detected in all cases and no interfering peaks were observed. In addition, a similar enantiomeric resolution for the salbutamol standard and the salbutamol contained in the different pharmaceutical preparations was observed. However, an increase in the migration times of the enantiomers of salbutamol detected in some of the different pharmaceutical preparations was observed with respect to the migration times of the enantiomers of the salbutamol standard. This result could be attributed to the effect of matrix components on the electroosmotic flow (EOF). According to Table 1 both syrups have a similar composition, being the difference that syrup (A) contain hydroxypropylmethylcellulose and sodium chloride instead of the hypromelose contained in syrup (B). Furthermore, the migration times observed for the salbutamol enantiomers of the oral solution are more similar to the standard solution than those of the syrups, probably due to the absence of compounds such as hydroxypropylmethylcellulose or hypromelose which can interact with the inner wall of the capillary when they are injected in the CE system [21]. On the other hand, although both kind of tablets studied have a more complex composition than the syrups or the oral solution studied, migration times of the enantiomers of salbutamol in these pharmaceutical preparations are similar to the migration times of.
(4) Electrophoresis 2003, 24, 2680–2686 the enantiomers of the salbutamol standard and similar between them, although their composition is also very different. These results could be explained taking into account the insolubility observed for some excipients when these tablets were dissolved in DMSO and which were separated from the solutions injected in the CE system by centrifugation. After these results, we checked if the chiral CE method was useful for the determination of the salbutamol content in the different pharmaceutical preparations considered.. 3.2 Quantitation of salbutamol in pharmaceutical preparations The quantitation of salbutamol by the chiral CE method was performed in different pharmaceutical preparations: two syrups, an oral solution, and two kind of tablets. For the calibration, corrected total peak areas, calculated as the addition of the corrected areas corresponding to the first and the second migrating enantiomers were used (the corrected area for each enantiomer was obtained by dividing the area of each electrophoretic peak by its corresponding migration time). Although the use of corrected areas in CE is frequent [22], in this case it was totally necessary in order to increase reproducibility of calibration data and also to compensate fluctuations in electrophoretic conditions due mainly to the compositions of the different samples injected and also due to the pH of the separation buffer (pH 5.0 is a critical value where small variations of pH values produce big differences in the electrophoretic mobility) [23]. Solutions of salbutamol standard with concentrations ranging from 0.005 to 0.400 mg/mL were injected by triplicate in order to determine the linear concentration range. It was observed a linear relationship between the total corrected area and the concentration of salbutamol in the concentration range between 0.005 and 0.120 mg/ mL. Therefore, solutions of salbutamol standard comprised from 0.005 to 0.120 mg/mL were prepared and injected by triplicate during three different days in the CE system in order to validate the calibration curve obtained by plotting corrected total peak area versus concentration. The equation obtained when the average of the corrected total peak area for the three lines considered versus the concentration was plotted is y = 0.187110.0362x being the standard error associated to the intercept 0.0289, to the slope 0.0004, and to the calibration curve 0.0515. The ANOVA of the average of the three calibration lines considered revealed that the lack of fit was always statistically smaller than the pure error, which confirmed that a straight line was a suitable model in the concentration range employed. In addition, a correlation coefficient equal to 0.9995 indicated a relatively strong relationship. Determination of salbutamol by chiral CE. 2683. between the variables. On the other hand, the sensitivity of this chiral CE method, corresponding to the slope of the calibration line, was 0.0362 mL?mg21 (0.036261023 mL?mg21). The slope and the standard error of the calibration curve were used to calculate the limit of detection (LOD) and the limit of quantitation (LOQ). LOD and LOQ were defined as the analyte concentrations given signals exceeding that of the intercept by 3 and 10 times, respectively, the standard error of the calibration curve [24]. The LOD calculated for salbutamol was about 4 mg/mL and the LOQ was about 14 mg/mL. In order to evaluate the precision of the CE method (see Table 2), repeatability and reproducibility were studied. The repeatability in migration time and peak area of the enantiomers and in the corrected total peak area, was determined (as RSD) for ten consecutive injections of a dilution in DMSO of each pharmaceutical preparation with a final concentration of 0.045 mg/mL in salbutamol. RSD was less than 5.0% for the migration times of the enantiomers, less than 5.4% for peak area of the enantiomers, and less than 4.8% for corrected total peak area. On the other hand, reproducibility in peak area and migration time of the enantiomers and in the corrected total peak area was measured as the RSD obtained in four different days (injections by triplicate) for sample dilutions of 0.045 mg/mL in salbutamol. As it can be observed in Table 2, the RSD values obtained were less than 5.5% for the migration times of the enantiomers, less than 6.5% for the peak area of the enantiomers, and for the corrected total peak area RSD was less than 6.0%. It should be emphasized that RSD values for the corrected total peak area are lower than those obtained for the peak area, that is, the precision obtained for the corrected total peak areas is better than those obtained with noncorrected peak areas, therefore, corrected peak areas were used for the calibration. Prior to the quantitative analysis, the presence or absence of matrix interferences was studied. Then, the slopes of the regression lines obtained by the external standard method and the standard addition method, which was applied to the different pharmaceutical preparations, were compared. Table 3 shows the calibration lines obtained for the variation of the corrected total peak area as a function of the concentration of salbutamol standard by the external standard method and as a function of the added concentration of salbutamol to the sample by the standard addition method. In addition, each calibration line was obtained as the average of three calibration lines obtained in three different days and each one validated by ANOVA. The comparison of these two regression lines obtained as explained above for each.
(5) 2684. E. Ekiert et al.. Electrophoresis 2003, 24, 2680–2686. Table 2. Precision in peak areas and migration times for salbutamol enantiomers and in corrected total peak area for salbutamol in five different pharmaceutical preparations by the CE methoda) Pharmaceutical preparation. Csb). t1 (RSD). t2 (RSD). A1 (RSD). A2 (RSD). At (RSD). Repeatabilityc). Syrup (A) Syrup (B) Oral solution (C) Tablet (D) Tablet (E). 0.045 0.045 0.045 0.045 0.045. 2.62 (3.06) 2.64 (4.97) 2.13 (1.48) 2.02 (2.82) 1.92 (1.74). 2.69 (3.13) 2.71 (4.28) 2.18 (1.51) 2.06 (2.86) 1.97 (1.77). 1.40 (3.24) 1.17 (3.78) 1.24 (3.49) 0.91 (5.43) 1.00 (3.58). 1.38 (3.50) 1.16 (3.79) 1.17 (3.76) 0.91 (4.90) 1.01 (4.12). 1.05 (3.39) 0.87 (2.41) 1.12 (4.76) 0.89 (3.73) 1.03 (3.10). Reproducibilityd). Syrup (A) Syrup (B) Oral solution (C) Tablet (D) Tablet (E). 0.045 0.045 0.045 0.045 0.045. 2.48 (3.87) 2.60 (4.42) 2.14 (1.65) 1.99 (5.45) 1.89 (2.98). 2.54 (3.94) 2.67 (4.48) 2.18 (1.52) 2.02 (5.17) 1.94 (3.35). 1.33 (4.13) 1.25 (6.49) 1.17 (6.19) 0.93 (4.46) 0.95 (4.37). 1.30 (5.99) 1.20 (6.16) 1.20 (4.01) 0.93 (5.67) 0.94 (4.79). 1.05 (4.76) 0.93 (3.63) 1.10 (6.00) 0.93 (4.83) 0.99 (3.88). Precision. t1 and t2 are the migration times corresponding to the first and the second migrating enantiomers, respectively; A1 and A2 are the peak areas for the first and the second migrating enantiomers, respectively; At is the corrected total peak area ((A1/ t1)1(A2/t2)) and the RSD value was calculated with the uncertainty of this mathematic operation [21]. a) Experimental conditions specified in Section 2.3 b) Concentration of salbutamol in a solution prepared by dilution of the commercial preparation (mg/mL) c) RSD values determined for ten consecutive injections d) RSD values determined for four different days (each injection was made by triplicate). Table 3. Comparison of the calibration linesa) obtained by the external standard method and the standard addition method for the different pharmaceutical preparations studied. Pharmaceutical preparation. External standard methodb). Standard addition methodc). Syrup (A). y = 0.187110.0362x (n = 9, r = 0.9995) y = 0.187110.0362x (n = 9, r = 0.9995) y = 0.187110.0362x (n = 9, r = 0.9995) y = 0.187110.0362x (n = 9, r = 0.9995) y = 0.187110.0362x (n = 9, r = 0.9995). y = 0.735610.0420x (n = 4, r = 0.9997) y = 0.760610.0497x (n = 4, r = 0.9991) y = 0.709910.0473x (n = 4, r = 0.9999) y = 0.691310.0404x (n = 4, r = 0.9999) y = 0.683310.0417x (n = 4, r = 0.9995). Syrup (B) Oral solution (C) Tablet (D) Tablet (E). a) Calibration lines obtained as the average of three calibration curves obtained in three different days (n, number of points considered for the calibration curve; r, correlation coefficient) b) Concentration range for the salbutamol standard: 0.005–0.120 mg/mL c) Concentration range for the salbutamol standard added to the pharmaceutical preparations (dilution containing 0.015 mg/mL of salbutamol sulfate): 0– 0.06 mg/mL. calibration method and for each pharmaceutical preparation revealed that statistically significant differences (P,0.05) among the slopes were observed for all the pharmaceutical preparations studied. Then, the presence of matrix interferences was detected being necessary to use the standard addition method for the quantitation of salbutamol. The salbutamol content in the different pharmaceutical preparations studied was determined from a standard addition line obtained as average of three calibration lines obtained in three different days and validated by ANOVA for each pharmaceutical preparation. Table 4 groups the salbutamol content determined by the chiral CE method and the salbutamol content calculated taking into account the salbutamol content decleared in the label of the product and the dilution in DMSO. Results show that differences in both values obtained for the syrup (B) and the oral solution (C) were 2 and 0%, respectively, whereas for the other three pharmaceutical preparations studied (syrup (A) and tablets (D) and (E)) these differences were about 17, 14, and 9%, respectively. Finally, as the interconversion of enantiomers of a chiral compound can occur with time [11] and their stability can be different, it seems interesting to test the change in the proportion of the enantiomers in stored pharmaceu-.
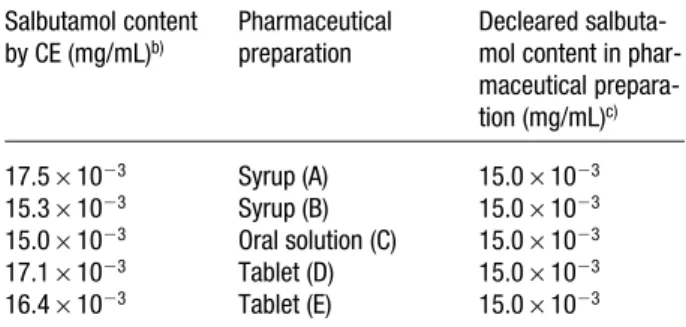
(6) Electrophoresis 2003, 24, 2680–2686. Determination of salbutamol by chiral CE. Table 4. Quantitative analysis of salbutamol in different pharmaceutical preparations by the chiral CE methoda) Salbutamol content by CE (mg/mL)b). Pharmaceutical preparation. Decleared salbutamol content in pharmaceutical preparation (mg/mL)c). 17.561023 15.361023 15.061023 17.161023 16.461023. Syrup (A) Syrup (B) Oral solution (C) Tablet (D) Tablet (E). 15.061023 15.061023 15.061023 15.061023 15.061023. a) Experimental conditions specified in Section 2.2 b) Concentration of salbutamol determined by the chiral CE method c) Concentration of salbutamol obtained by dilution of the pharmaceutical preparations considering the salbutamol content indicated in the label of each preparation. tical preparations with a rapid and simple method as used in this work. The oral solution (C) studied in this work is prepared by the patient from a powder by dissolving it in water and storing it in a fridge for consumption to a maximum of ten days. The chiral method was applied to study the stability of the salbutamol enantiomes in this oral solution. In this case, the enantiomeric ratio values for the oral solution (C) were calculated in order to study if there was variation in the proportion of the enantiomers of salbutamol when the oral solution was injected after being opened and after being opened and stored in the fridge for two months. The enantiomeric ratio was calculated as the corrected area of the second migrating enantiomer divided by the corrected area of the first migrating enantiomer. An enantiomeric ratio value of 0.92 was obtained when dilutions in DMSO of the oral solution (C) containing 0.040 mg/mL in salbutamol was opened and immediately injected in the CE system, and a value of 0.98 was obtained when dilutions were analyzed after the formulation was opened and stored for two months. Since the differences between both values of enantiomeric ratio can be considered within the experimental error, the results indicated that the racemate has been remained after the oral solution (C) was opened and stored during a long time.. 4 Concluding remarks The application of a fast and simple chiral CE method based on the use of a 25 mM acetate buffer at pH 5 with 13.1 mg/mL CM-b-CD at 257C and 20 kV as the separation voltage for the quantitation of salbutamol in different pharmaceutical preparations (two syrups, an oral solu-. 2685. tion, and two kinds of tablets) containing a racemate of salbutamol was performed in this work. Although differences in the migration times were observed for the different formulations studied, which were attributed to the influence of their different composition on the electrophoretic mobility, the use of corrected total peak area enabled to compensate the fluctuations in the electrophoretic conditions. The chiral CE method was characterized by a linear concentration range from 0.005 to 0.120 mg/mL of salbutamol, LOD of salbutamol about 4 mg/mL, and acceptable values of precision (repeatability and reproducibility) in terms of migration time, peak area, and corrected total peak area. For the quantitation of salbutamol in the different pharmaceutical preparations studied the standard additions method was used for the calibration due to the existence of matrix interferences for a 95% confidence level. Finally, the stability of the enantiomers in the oral solution was studied calculating the enantiomeric ratio values obtained when it was injected after being opened and after being opened and stored in the fridge for two months obtaining no significant differences. The authors thank the Comisión Interministerial de Ciencia y Tecnología (Spain) for project PB98–0709. Dr. M. A. García thanks the Universidad de Alcalá (Madrid, Spain) for project E027/2001. Received March 3, 2003. 5 References [1] Goodman Gilman, A., Rall, T. W., Nies, A. S., Taylor, P., The Pharmacological Basis of Therapeutic, Pergamon Press, Elmsford, NY 1990. [2] Boulton, D. W., Fawcett, J. P., Br. J. Clin. Pharmacol. 1996, 41, 35–40. [3] Gotti, R., Furlanetto, S., Andrisano, V., Cavrini, V., Pinzauti, S., J. Chromatogr. A 2000, 875, 411–422. [4] Chankvetadze, B., Capillary Electrophoresis in Chiral Analysis, John Wiley & Sons, Chichester 1997. [5] Blaschke, G., Chankvetadze., B., J. Chromatogr. A 2000, 875, 3–25. [6] Altria, K. V., J. Chromatogr. A 1999, 856, 443–463. [7] Ward, T. J., Farris III, A. B., J. Chromatogr. A 2001, 906, 73– 89. [8] Chankvetadze, B., Blaschke, G., J. Chromatogr. A 2001, 906, 309–363. [9] Vescina, M. C., Fermier, A. M., Guo, Y., J. Chromatogr. A 2002, 973, 187–196. [10] Maier, N. M., Franco, P., Lindner, W., J. Chromatogr. 2001, 906, 3–33. [11] Altria, K. D., Goodall, D. M., Rogan, M. M., Electrophoresis 1994, 15, 824–827. [12] Blanco, M., Gonzalez, J. M., Torras, E., Valverde, I., Anal. Bioanal. Chem. 2003, 375, 157–163. [13] Wilstrom, H., Owens, P. K., J. Sep. Sci. 2002, 25, 1167– 1174..
(7) 2686. E. Ekiert et al.. [14] Roig, M., Bergés, R., Ventura, R., Fich, K. D., Morton, A. R., Segura, J., J. Chromatogr. A 2002, 768, 315–324. [15] Gausepohl, C., Blaschke, G., J. Chromatogr. B 1998, 713, 443–446. [16] Esquisabel, A., Hernández, R. M., Gascón, A. R., Igartua, M., Calvo, B., Pedraz, J. L., J. Pharm. Biomed. Anal. 1997, 16, 357–366. [17] Vela, J., Yanes, E. G., Stalcup, A. M., Fresenius’ J. Anal. Chem. 2001, 369, 212–219. [18] García-Ruiz, C., Marina, M. L., Electrophoresis 2001, 22, 3191–3197. [19] Microsoft Excel 97, Microsoft corporation, 1995–1996.. Electrophoresis 2003, 24, 2680–2686 [20] Statgraphics Plus for Windows, Version 5.0, Microsoft corporation, 1994–2000. [21] Oda, R.P., Landers, J. P., in: Landers, J. P. (Ed.), Handbook of Capillary Electrophoresis, CRC Press, Boca Raton, FL 1993. [22] Schaeper, J. P., Sepaniak, M. J., Electrophoresis 2000, 21, 1421–1429. [23] Introduction to Capillary Electrophoresis, Beckman Instruments, Inc., Fullerton, CA 1991. [24] Miller, J. N., Miller, J. C., Statistics and Chemometrics for Analytical Chemistry, Prentice Hall, 4th edition, Dorchester 2000..
(8)
Figure


Documento similar
As shown in Fig. 1D the yield points of all curves are accurately predicted by the alignment parameter when the true stress-true strain curve of the MS fiber tested in water
Dispersive Solid-Phase Microextraction Method for Sample Extraction in the Analysis of Four Tetracyclines in Water and Milk Samples by High-Performance Liquid
Average II-BW spectra obtained at three time points of the HFHS diet (1 week, 12 weeks, and 52 weeks) with three replicates of mice that: (B) were only shaved; (C) had their
These results can be observed in Figure 4 which shows the EIEs obtained by CE-MS2 for glycine betaine, trigonelline and total content of carnitines in a soybean oil sample RSYO-3,
Development of an in-capillary derivatization method by CE for the determination of chiral amino acids in dietary supplements and wines A fast in-capillary derivatization method by
This is due to include some suggestions that can not be considered as good analytical validation practise: low number of calibration levels (j = 4); narrow
Optimized analysis conditions for cabergoline analysis were performed using 110 mM pH 5.0 phosphate buffer containing 30 % acetonitrile as an electrolyte solution. Separation
A simple and selective method based on capillary electrophoresis with amperometric detec- tion has been developed for the separation and determination of berberine BB and
