SEFO
SPANISH AND INTERNATIONAL ECONOMIC & FINANCIAL OUTLOOK
VOLUME 10 | number 3, May 2021
The impact of the pandemic on Spain’s businesses
The impact of the pandemic on Spanish household and corporate sector accounts Spain’s business
demographics post-COVID-19:
An initial assessment The resilience of Spain’s manufacturers in the face of COVID-19
Stimulating business creation:
Analysis and proposals
Market values of European and Spanish banks: Contraction and recovery against the backdrop of COVID-19 Payments in year two of the pandemic
Deterioration in Spain’s
public finances in the wake of WHAT MATTERS
SEFO
Spanish and International Economic & Financial OutlookVOLUME 10 | number 3, May 2021Orders or claims:
Funcas
Caballero de Gracia, 28 28013 Madrid (España) Teléfono: 91 596 54 81 Fax: 91 596 57 96 [email protected] www.funcas.es
ISSN: 2254 - 3880 9772254388005
9772254389002
SEFO
SPANISH AND INTERNATIONAL ECONOMIC & FINANCIAL OUTLOOK
This page was left blank intentionally.
Letter from the Editors
rogress on the vaccination front, albeit highly uneven, has ushered in a change in global economic momentum that is already being foreshadowed by economic indicators.
This wave of growth is reaching Europe and should be supported further by the upcoming disbursement of Next Generation EU funds.
Economic indicators in Spain too are sending broadly positive signals, pointing to a recovery.
Within this context, the publication of the May issue of Spanish and International Economic
& Financial Outlook (SEFO) is marked by a more constructive backdrop.
As Spain heads into the second stage of the COVID-19 crisis, the recovery phase, this issue of SEFO takes a look at the asymmetrical impact of the crisis on Spain’s business fabric, both in broad terms and for specific industry segments.
To frame our analysis, we start out this issue of SEFO by assessing the impact of the pandemic on households and corporates.
Although the impact of COVID-19 on the Spanish economy was substantial, the extent to which it hit the household and corporate sectors’ finances differed in several notable ways. Thanks to generous government protection measures, such as the furlough and income support schemes, households’
gross disposable income (GDI) declined by just 3.3% in 2020, which is considerably lower than the contraction in GDP. Notably,
Spain’s household savings rate shot up to 14.7% of GDI in 2020 from 6.3% in 2019. That said, it is possible the drop in income was concentrated in low-income households, while the growth in savings occurred primarily in medium- and high-income households, which could have consequences for post-pandemic consumption and savings trends. Meanwhile, gross operating profit of the non-financial corporate sector declined by 18% in 2020 with the sector’s net lending position deteriorating to 2.4% of GDP. This has contributed to a fall in the number of businesses operating in Spain. While the recently announced government support measures directed towards the business community were a welcome development, these data suggest that additional measures are needed in order to prevent even greater structural damage. That said, the increase in public indebtedness could leave the economy more vulnerable when the ECB eventually winds down asset purchases.
We then focus on Spain’s business demographics as a consequence of the pandemic. Specifically, this SEFO places particular emphasis on the performance of the manufacturing sector – a sector that seems to have demonstrated resilience in the face of the COVID-19 crisis in terms of output, but may face a mixed outlook going forward, given the contraction in new businesses created and some deterioration in employment trends.
P
Although previous crises have had adverse effects on business volume indicators and corporate dynamism, the extent to which COVID-19 has impacted Spanish businesses is unprecedented. For example, business turnover in the first few months of the pandemic contracted by nearly twice as much as during the financial crisis. In terms of corporate dynamism, there was an average year-on-year reduction in the number of net new businesses of 72% in April 2020. However, closer analysis reveals that some sectors have been hit harder than others, with the subsequent recovery speeds also differing across industries. While the manufacturing industry contracted for 15 consecutive months during the financial crisis, it has sustained a relatively rapid recovery in turnover during the COVID-19 crisis. Conversely, turnover in the retail sector remains 10% below pre-crisis levels. Although it is difficult to be more precise, evidence suggests that the positive performance within the retail sector comes from the sale of food and everyday products, while the rest of the retail sector is still struggling with uncertainty and difficulties. That said, manufacturing fared less well in terms of business dynamism, where the number of net new businesses contracted by 20%, slightly less than the 22% registered by the hospitality sector (accommodation and food service activities).
These data highlight the need to design economic support measures in accordance with each sector’s trajectory, reality and reasonable outlook.
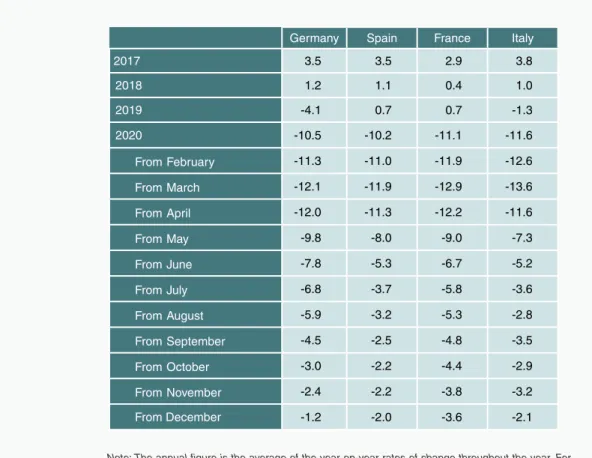
While Spain’s GDP contracted by more than the other core EU countries in 2020, its manufacturing sector has proved surprisingly resilient. At 10.8%, the Spanish manufacturing sector’s GVA posted the smallest contraction, with Germany’s manufacturing GVA plunging by 11.3%, more than double its fall in GDP.
Admittedly, part of this is explainable by the fact that tourism, a key sector for Spain, collapsed in 2020, weighing heavily on GDP. Also relevant is the fact that Spain entered the crisis after several years of stronger growth in output in the manufacturing sector compared to Germany, France and Italy. Notably, the recovery in Spanish manufacturing took longer to emerge due to the prolongation of lockdown measures compared
with peer countries. However, by December 2020, Spanish manufacturing production was down just 2% year-on-year. In terms of manufacturing employment trends, Spanish firms had a strong record of job creation going into the crisis.
However, by the second quarter of 2020, the number of hours worked in the manufacturing industry had fallen significantly, with job losses rising incrementally despite the temporary job protection scheme.
Apart from assessing the performance of Spain businesses to date, we look ahead at the outlook for business creation in Spain, taking into account the relevant policy considerations necessary to underpin a constructive environment.
The Ministry of Economic Affairs and Digital Transformation has published a document titled
“Measures for Fostering Business Creation and Growth” that argues in favour of increasing the average size of Spain’s enterprises to close the productivity gap. But many studies show that it is not company size that determines productivity levels but productivity that determines size and that the breakdown of a country’s enterprises by size segments is the result of market discipline, competition and management practices. Although the government argues that the minimum capital required for setting up an LLC is an impediment to business creation, reducing this amount could send a misleading message to start ups about the real financial needs of going into business. More attention should also be paid to the employer and management training market in Spain and the gap in formal education between the two. In terms of regulations relating to enterprise size thresholds, it may be necessary to review these but such a review should be approached from a broad perspective that takes general interest goals into account. Lastly, business creation policy underestimated the internal costs of growth. As a first step in taking them into consideration, the government could benefit from commissioning a white book on management practices in Spain.
The next section of the May SEFO shifts the attention back to the financial system. First, we analyse the performance of European bank stocks throughout the pandemic. As well, we look
share prices took a significant hit during the peak of the COVID-19 crisis. Measured using price- to-book value, Spanish and European banks were trading at a low of 0.3x (i.e. at a discount to their book value of 70%) in 2020. At the start of the crisis, some bank stocks lost more than 50% of their value, compared to average index correction of 20-25%. However, towards the end of 2020 and beginning of 2021, banks have been one of the best-performing sectors, significantly outperforming the broader indices. Although both European and Spanish banks’ share prices have rebounded, the recovery has been more intense for the Spanish banking sector. These strong recoveries are due to monetary and fiscal measures as well as a rebound in M&A activity and progress on the vaccination front. Banks’
shares also received a significant boost from the sizeable upward shift in rate curves.
Notably, the experience of banks’ CoCo bonds has highlighted the asymmetric nature of these instruments. Their prices contracted by less than ordinary bank shares yet went on to rebound more strongly.
COVID-19 has accelerated shifts in social and economic patterns that predate the crisis, including those in the retail payments sphere.
Last year, there were 4.7 billion card transactions at the point of sale (PoS), up 4.4% from 2019.
This is despite the overall drop in the volume of transactions due to strict lockdowns and social distancing requirements. Although the growth rate in card payments is lower than seen in previous years, the contraction in cash sales was considerably more pronounced in 2020.
Evidence also shows an increased willingness of consumers to use alternative digital payment options. For example, the percentage of the population that made a payment from their mobile handset increased from 55.66% before the pandemic to 63.22 % during the final months of 2020. Meanwhile, the percentage of the population using P2P applications to transfer money increased from 62.79% to 75.26% over the same timeframe. Looking forward, QR codes and biometric payments are expected to grow in
to determine the extent of the shift in consumer preferences for payment technologies until some degree of normality returns.
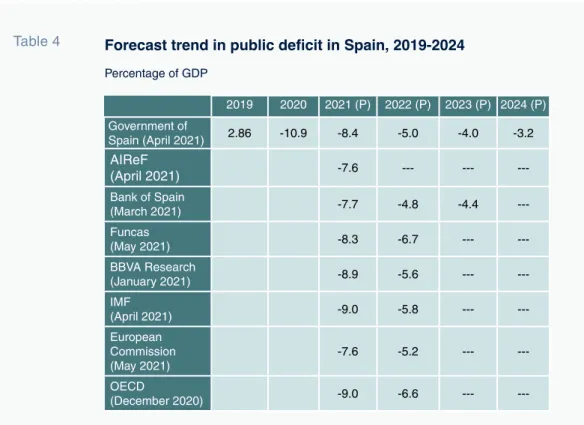
Finally, we close the issue with an assessment of the health of public balances, as well as present the latest forecasts as regards the evolution of Spain’s deficit and debt figures.
Spain reported a public deficit of 10.1% of GDP in 2020, which ultimately rose to 11.0% following the assumption of the reclassified deficit of the SAREB, or Spain’s so-called bad bank. Much of this was concentrated in the central government, whose deficit came in 0.89 percentage points of GDP higher than initially forecast due in large part to transfers made to sub-central governments. The deficit is the result of two primary factors: an increase in spending and a fall in revenue. Specifically, spending rose to finance furlough schemes, healthcare expenses and income support for the self-employed. While personal income tax receipts rose in 2020, VAT and corporate tax receipts plummeted. The 2021 General State Budget includes a deficit of 8.4% of GDP in 2021. Upward pressure on the deficit could come from solvency support for the corporate sector and the rollover of fiscal and bankruptcy protection. Downward pressure on the deficit could arise from a positive trend in corporate income tax, VAT revenue and the gradual withdrawal of the measures passed in 2020 to mitigate the effects of the pandemic.
However, the uncertainty regarding the economy and, particularly, the absence of a medium-term consolidation plan, raises considerable doubts about the forecast trajectory in public debt over the coming years.
This page was left blank intentionally.
Month Day Indicator / Event June 1 Tourist arrivals (May)
2 Social Security registrants and official unemployment (May) 7 Industrial production index (April)
10 ECB monetary policy meeting 11 CPI (May)
17 Eurogroup meeting
17 Foreign trade report (April)
24 Quarterly National Accounts (1st quarter 2020, 2nd release) 24 Balance of payments quarterly (1st quarter 2020)
24-25 European Council meeting 29 Retail trade (May)
29 Preliminary CPI (June)
30 Non-financial accounts, State (May)
30 Non-financial accounts, Regional Governments and Social Security (April) 30 Non-financial accounts, General Government (1st quarter 2020)
30 Balance of payments monthly (April)
30 Quarterly Non-financial Sector Accounts (1st quarter 2020) July 2 Social Security registrants and official unemployment (June)
2 Tourist arrivals (June)
6 Industrial production index (May)
12 Quarterly Financial Accounts (1st quarter 2020) 14 CPI (June)
16 Foreign trade report (May) 22 ECB monetary policy meeting
29 Labour Force Survey (2nd quarter 2020) 29 Preliminary CPI (July)
30 Retail trade (June)
30 Non-financial accounts, State (June)
30 Non-financial accounts, Regional Governments and Social Security (May) 30 Preliminary Quarterly National Accounts (2nd quarter 2020)
30 Balance of payments monthly (May)
This page was left blank intentionally.
The impact of the pandemic on Spanish household and corporate sector accounts Data show that COVID-19’s impact on Spanish households has been smaller than that sustained by its non-financial corporations, thanks in part to generous support schemes for Spanish workers. Going forward, additional measures will be required to buoy Spanish firms, but this could leave Spain´s public debt more vulnerable if the ECB tightens its monetary policy stance.
María Jesús Fernández
Spain’s business demographics post-COVID-19:
An initial assessment
While the effect of COVID-19 on Spanish business demographics has been unprecedented, it has also been unequal, with certain sectors hit harder or recovering faster than others. For this reason, any economic recovery plan should consider the needs and vulnerabilities of specific sectors.
Ramon Xifré
5
15
The resilience of Spain’s manufacturers in the face of COVID-19
In comparison with peer countries, Spain’s manufacturing output held up relatively well amidst a historic contraction in GDP. That said, despite its strong track record in job creation prior to the crisis, the number of hours worked and employees in the manufacturing sector fell as a result of the pandemic.
María José Moral
27
Payments in year two of the pandemic The pandemic has accelerated the use of new payment technologies, such as mobile and P2P payments, with future growth projected in the use of QR codes and biometric payments. However, only once the crisis dissipates will it be possible to assess the strength of these trends.
Santiago Carbó Valverde, Pedro Cuadros Solas and Francisco Rodríguez Fernández
55
Market values of European and Spanish banks: Contraction and recovery against the backdrop of COVID-19
European and Spanish banks’ share prices took a significant hit during the worst periods of the COVID-19 crisis, only to outperform other stocks once a recovery took hold. Interestingly, banks’ CoCo bonds performed even better, registering a smaller contraction and a stronger rebound.
Ángel Berges, Fernando Rojas and Diego Aires, A.F.I.
47
Stimulating business creation: Analysis and proposals
Although the Spanish government has focused on average enterprise size as a means of closing the productivity gap, studies show that it is productivity that determines size. In order to spur business creation, more attention should be paid to those factors that shape the internal costs of growth in Spain.
Emilio Huerta Arribas, Alfonso Novales Cinca and Vicente Salas Fumás
37
Regulation and Economic Outlook
Recent key developments in the area of Spanish financial regulation
75
Prepared by the Regulation and Research Department of the Spanish Confederation of Savings Banks
Spanish economic forecasts panel: May 2021
81
Funcas Economic Trends and Statistics Department
Key Facts
Economic Indicators
89
Financial System Indicators
127
Social Indicators
133
wake of COVID-19
The spike in Spain’s deficit in 2020 was the result of higher spending and lower tax revenue due to the COVID-19 pandemic. Although the government is forecasting smaller deficits in the coming years, Spain lacks a credible deficit consolidation plan.
Desiderio Romero-Jordán and José Félix Sanz-Sanz
63
This page was left blank intentionally.
The impact of the pandemic on Spanish household and corporate sector accounts
Data show that COVID-19’s impact on Spanish households has been smaller than that sustained by its non-financial corporations, thanks in part to generous support schemes for Spanish workers. Going forward, additional measures will be required to buoy Spanish firms, but this could leave Spain´s public debt more vulnerable if the ECB tightens its monetary policy stance.
Abstract: Although the impact of COVID-19 on the Spanish economy was substantial, the extent to which it hit the household and corporate sectors’ finances differed in several notable ways. Thanks to generous government protection measures, such as the furlough and income support schemes, households’
gross disposable income (GDI) declined by just 3.3% in 2020, which is considerably lower than the contraction in GDP. Notably, Spain’s household savings rate shot up to
14.7% of GDI in 2020 from 6.3% in 2019. That said, it is possible the drop in income was concentrated in low-income households, while the growth in savings occurred primarily in medium- and high-income households, which could have consequences for post-pandemic consumption and savings trends. Meanwhile, gross operating profit of the non-financial corporate sector declined by 18% in 2020 with the sector’s net lending position deteriorating to 2.4% of GDP. This has contributed to a fall in María Jesús Fernández
the number of businesses operating in Spain.
While the recently announced government support measures directed towards the business community were a welcome development, these data suggest that additional measures are needed in order to prevent even greater structural damage. That said, the increase in public indebtedness could leave the economy more vulnerable when the ECB eventually winds down asset purchases.
Introduction
The COVID-19 pandemic has wreaked unprecedented havoc on global and national economies. For Spain, the economic pain has been particularly severe, with GDP contracting by 10.8% in 2020. This paper analyses the impact on the financial situation of Spain’s households and businesses based on the non- financial quarterly accounts by institutional sector compiled by Spain’s national statistics office, the INE, and the financial accounts drawn up by the Bank of Spain.
The data show that the impact on Spain’s households has been smaller than that sustained by its non-financial corporations, primarily because the bulk of the protection measures implemented by the government have been targeted at households. In fact, one of the most noteworthy consequences of this crisis has been the record rise in the household savings rate. It is important to note, however, that while at first sight the impact of COVID-19 on households appears moderate, significant disparity likely exists below the headline data.
Spain’s households generate record savings
Households’ gross disposable income (GDI) declined by 3.3%, or 25 billion euros, in 2020,
a reduction that appears modest compared with the scale of Spain’s GDP contraction.
Notably, at 8.7%, the drop in salaries paid by corporations, and in other income, such as the gross operating profit of the self-employed and dividend income, was greater than the fall in GDI. This is explained by two factors:
(i) growth in the salaries paid by the public sector, which increased by 4.5%; and, (ii) a sharp increase in social benefits, of close to 14% (Table 1). The increase in social benefits materialised through: payments made by the government to furloughed employees and to self-employed professionals forced to stop working; growth in unemployment benefits;
and growth in pension expenditure, among other benefits. The taxes and social security contributions paid by households barely changed, despite the dip in their GDI.
The 12% drop in consumption was significantly greater than the reduction in income. As a result, savings surged by 60.8 billion euros to reach 108.8 billion euros, which is more than double the 2019 figure. The savings rate, which was equivalent to 6.3% of GDI in 2019, shot up to 14.7% in 2020, a record high (the last record in the series —of 11.3%— was recorded in 2009).
As for the quarterly trend, the savings rate peaked at 25.7% during the second quarter, which corresponds to the strictest lockdown period. The savings rate subsequently fell to 10.6% in the fourth quarter. The second quarter’s sharp increase in the savings rate reflects the fact that opportunities to spend were highly constrained by lockdown measures. In the following quarters, as the lockdown ended and businesses reopened, forced savings declined but did not disappear, due to continued restrictions on opening hours, capacity, interregional mobility, etc.
That, coupled with the probable increase in precautionary savings and, possibly additional
“ At 8.7%, the drop in salaries paid by corporations, and in other
income, such as the gross operating profit of the self-employed and
dividend income, was greater than the fall in GDI in 2020. ”
savings as a result of the voluntary avoidance of certain activities outside the home, explains why the savings rate stayed so high.
This pattern mirrors that etched out across the eurozone, although the increase in the savings rate in Spain has exceeded the eurozone average (Exhibit 1). While the eurozone’s savings rate reached a similar level to Spain’s during the second quarter, it started from a level that was twice that of Spain’s savings rate. The bigger increase in Spain’s savings rate reflects a bigger contraction in private consumption,
as a result of the greater impact of the crisis, coupled with more stringent restrictions.
As well, relative to the eurozone average, Spaniards spend more of their income on those activities and purchases curtailed by lockdown and social distancing measures.
For example, in 2015, the last year for which comparable data are available, expenditure on hotels and restaurants accounted for 9.3% of Spaniards’ total annual expenditure, compared to 6% in the eurozone, helping explain the higher initial drop in consumption in Spain.
Table 1 Non-financial accounts - household sector
Millions of euros
2019 2020 Change
Salaries paid by the public sector 134,463 140,470 6,007 Other salaried earnings received
by households 439,003 401,976 -37,027
Other income and current
transfers received by households 254,442 230,627 -23,815
Social benefits 215,309 245,166 29,857
Tax and social security contributions
paid by households 278,624 278,654 30
Gross disposable income 764,593 739,585 -25,008
Consumption 713,803 628,198 -85,605
Savings 48,037 108,844 60,807
Gross capital formation 42,462 35,680 -6,782
Net lending (+) /borrowing (-)
position 3,130 72,989 69,859
Note: Household savings is not exactly equivalent to the difference between GDI and consumption due to the movements in their share of pension funds. Similarly, the net lending or borrowing position is not exactly equal to savings less investment due to the net capital transfers paid.
Source: INE.
“ While the eurozone’s savings rate reached a similar level to Spain’s
during the second quarter of 2020, it started from a level that was
twice that of Spain’s savings rate. ”
The trend in Spain’s savings rate has been markedly pro-cyclical since the turn of the century, falling by more than the eurozone average during periods of growth and rising higher during economic crises. It is possible that these trends could be self-fulfilling. As savings fall significantly during periods of growth, households build up less of a financial buffer, so that when the next crisis comes along, they have to tighten their belts more intensely.
It is possible to estimate the magnitude by which household savings are above the level desired by calculating the difference between effective savings (108 billion euros) and the result of multiplying the average savings rate recorded between 2014 and 2019 —6.4%—
by GDI. Based on that calculation, surplus savings stand at around 60 billion euros, which is equivalent to 8.5% of consumption
in 2019. Elsewhere, we can estimate the volume of precautionary savings at 32 billion euros [1], which puts the level of forced or surplus savings over precautionary savings at around 28 billion euros (Exhibit 2).
Note that the aggregate trend for the household sector may mask pronounced differences at a more disaggregated level. It is probable, for example, that the drop in income was concentrated in low-income households while the growth in savings occurred primarily in medium- and high-income households.
Although there are no statistics available yet to confirm this assumption, it is underpinned by the fact that most of the jobs destroyed or negatively affected by the crisis have been relatively unskilled jobs [2].
It is unlikely that households will spend all their savings accumulated in 2020. One
0 5 10 15 20 25 30
1Q18 2Q18 3Q18 4Q18 1Q19 2Q19 3Q19 4Q19 1Q20 2Q20 3Q20 4Q20 Eurozone Spain
Exhibit 1 Household savings rate
Percentage of GDI
Source: Eurostat.
“ Savings accumulated in the rest of the eurozone should also prove
a source of growth in spending, providing additional momentum for
the Spanish economy via exports. ”
reason for this is that those savings are concentrated in higher-income households with a lower marginal propensity to spend.
Nevertheless, it constitutes an important potential driver of growth in household consumption —or even investment— once the remaining business and mobility restrictions are removed. Savings accumulated in the rest of the eurozone should also prove a source of growth in spending, providing additional momentum for the Spanish economy via exports. If the savings buffer is not spent or invested, the result would be a reduced need for credit, thereby accelerating the household deleveraging process.
Of the 108 billion euros of savings accumulated in the crisis, households invested 35 billion euros, down 16% from 2019. As a result, Spain’s households generated a net lending position of close to 73 billion euros, equivalent
to 6.5% of GDP in 2020. Note that the previous high of 19.9 billion euros was recorded in 2013 (Exhibit 3).
Meanwhile, 4.3 billion euros of the savings surplus was used to repay debt. This is well below the amount earmarked for debt repayment between 2011 and 2016.
Considering that new loans to households declined by 10 billion euros in 2020, it is fair to say that money was used not to prepay debt but rather to reduce reliance on credit. Despite the reduction in household borrowings in absolute terms, as a percentage of GDP, leverage rose to 62.5%, the first increase since 2009. Given that that increase was entirely attributable to the contraction in the denominator, it is foreseeable that once the recovery gains traction, the leverage ratio will return to its pre-crisis trendline. This is made more likely by the fact that the financial buffer
51,709
41,473 48,990 49,249
41,767 41,798 48,037
48,000 32,000 28,000
0 20,000 40,000 60,000 80,000 100,000 120,000
2013 2014 2015 2016 2017 2018 2019 2020
Natural savings Precautionary savings Forced savings
Exhibit 2 Breakdown of household savings
Millions of euros
Source: INE and Funcas.
“ Considering that new loans to households declined by 10 billion
euros in 2020, it is fair to say that money was used not to prepay
debt but rather to reduce reliance on credit. ”
generated in 2020 could reduce households’
reliance on credit.
The rest of the financial surplus went mainly to bank deposits (64.5 billion euros) and, to a far lesser degree, to increased cash holdings or the purchase of other financial assets.
Despite the huge volume of net purchases of financial assets in 2020 and the decline in liabilities, the household sector’s overall net asset value declined as a result of the correction in the value of equities and investment fund holdings.
Deleveraging at non-financial corporations interrupted
The gross operating profit (GOP) of the non-financial corporate sector declined by 18% in 2020, which is equivalent to nearly 51 billion euros, the biggest drop in the series. The decline in profit was greater than the reduction in salaries paid, so that the
percentage of gross value added accounted for by GOP declined to 40.8%, the lowest level since 2008.
The drop in GOP is echoed in the earnings reported by the Bank of Spain, specifically by its central balance sheet data office, which points to a drop in GOP of 36.8% in 2020, accompanied by a significant reduction in profitability margins (refer to the Bank of Spain, 2021). Likewise, the percentage of firms reporting negative profit margins increased by 8 percentage points to around 35%.
Dividend income fell sharply, while net interest paid on borrowings also fell. Lastly, tax payments decreased by 1.4 billion euros, while the sum earmarked to the payment of dividends declined by nearly 35 billion euros.
As a result, the corporate sector’s disposable income —profit after tax and dividend
-80,000 -60,000 -40,000 -20,000 0 20,000 40,000 60,000 80,000
1995 1996 1997 1998 1999 2000 2001 2002 2003 2004 2005 2006 2007 2008 2009 2010 2011 2012 2013 2014 2015 2016 2017 2018 2019 2020
Exhibit 3 Net lending (+) /borrowing (-) position of households
Millions of euros
Source: INE.
“ Despite cutting investment sharply, the non-financial corporations’
net lending position deteriorated significantly to 2.4% of GDP. ”
payments— declined by 36.8 billion euros.
Thus, despite cutting investment sharply, the non-financial corporations’ net lending position fell significantly to 2.4% of GDP (Table 2).
Analysing the results by quarter reveals that GOP sustained the biggest contraction in
the second quarter, going on to recover only partially in the third quarter. During both the third and fourth quarters (when the recovery stalled), the non-financial corporations’ GOP remained below pre- crisis levels by around 10 billion euros (in each quarter) (Exhibit 4).
Table 2 Non-financial accounts — non-financial corporations
Millions of euros
2019 2020 Change
Gross value added 654,766 565,487 -89,279
Wages paid 371,504 339,241 -32,263
Gross operating profit 281,572 230,602 -50,970
Interest and dividends received 60,996 39,197 -21,799
Interest paid 11,335 9,343 -1,992
Dividends paid 83,723 49,119 -34,604
Income tax paid 18,592 17,208 -1,384
Gross disposable income 218,227 181,418 -36,809
Gross capital formation 187,484 159,136 -28,348
Net lending (+) /borrowing (-) position 33,808 26,958 -6,850
Source: INE.
45,000 50,000 55,000 60,000 65,000 70,000 75,000
1Q19 2Q19 3Q19 4Q19 1Q20 2Q20 3Q20 4Q20
Exhibit 4 Gross operating profit of non-financial corporations
Millions of euros, adjusted for seasonality
Source: INE.
As for the financial accounts, Spain’s corporations increased their borrowings and their financial asset holdings. The increase in the latter may reflect the rerouting of profits that would otherwise have been invested in order to build a liquidity buffer in the face of such pronounced uncertainty. The ratio of unconsolidated debt to GDP increased considerably to 107.7%, albeit more due to the contraction in GDP than the increase in absolute borrowings. That made 2020 the second year (after 2019) in which the corporate sector increased its debt in absolute terms after eight years of non-stop deleveraging, and the first year in which it increased as a percentage of GDP since 2010 (Exhibit 5).
Despite that, the amount of interest paid decreased, such that the increase in the sector’s financial burden, whether expressed as debt to GOP or interest payments in
relation to GOP, was mainly attributable to the reduction in profits, and not the higher cost of debt. Moreover, Spain’s firms took advantage of the state guarantee scheme to lengthen their debt maturity profiles. Therefore, it is likely that the sector’s credit ratios will return to more favourable levels once the recovery consolidates. However, the impact of the crisis varies as we drill down into the numbers, as shown by the increase in the number of firms in a more vulnerable situation, i.e., presenting less sustainable leverage ratios (refer to the Bank of Spain, 2021).
That increase in vulnerability, coupled with growth in the number of firms with negative profit ratios, materialised in a high rate of business destruction in 2020.
By the end of the year, there were 44,000 fewer companies registered with the Social Security than before the crisis. The longer the
“ The ratio of corporates’ unconsolidated debt to GDP increased considerably to 107.7%, albeit more due to the contraction in GDP than the increase in absolute borrowings. ”
80 90 100 110 120 130 140 150
2007 2008 2009 2010 2011 2012 2013 2014 2015 2016 2017 2018 2019 2020
Exhibit 5 Unconsolidated debt of non-financial corporations
Percentage of GDP
Source: Bank of Spain.
business and mobility restrictions last, the more firms will suffer irreversible damage and disappear. In fact, having stabilised in number during the second half of 2020, the early months of 2021 have been marked by fresh business destruction (Exhibit 6).
Against that backdrop, the aid package passed by the Spanish government, which includes 7 billion euros of direct aid for viable troubled businesses, appears insufficient.
Conclusions
Despite the severity of COVID-19’s impact on the Spanish economy in 2020, the overall effect on the household sector accounts has been fairly moderate, thanks to the protection measures rolled out by the government in the form of the furlough scheme and extraordinary income support for the self-employed. Spain’s households posted an unprecedented increase in savings and continued to reduce their indebtedness. Drilling down into the numbers, the impact on the lower income households
was probably harsher, although we do not yet have the statistics to support this.
The crisis has taken a greater toll on the corporate sector’s finances and earnings.
That sector has not enjoyed the same level of government support provided to Spain’s households and has suffered record losses in earnings and an increase in indebtedness and financial pressure. Notably, some firms have suffered more than others, with the share of firms posting negative margins and finding themselves above certain vulnerability thresholds increasing. This has led to a reduction in the number of Spanish businesses.
Although the government’s protection measures were costly, they were necessary to mitigate the social fallout from the crisis and prevent even greater structural damage. It is even possible to argue that these measures have not gone far enough in their support of
“ By the end of the year, there were 44,000 fewer companies registered with the Social Security than before the crisis. ”
1,200 1,220 1,240 1,260 1,280 1,300 1,320 1,340
Exhibit 6 No. of firms registered with the Social Security
Thousands, adjusted for seasonality
Source: Funcas based on Ministry of Inclusion, Social Security and Migration data.
Spain’s business community. However, the flip side has been an alarming increase in public indebtedness, leaving the Spanish economy particularly vulnerable. This vulnerability will become even more acute when the European Central Bank winds down its asset purchases.
Notes
[1] This uses a model to calculate household savings as a function of the change in households’ real disposable income and the number of hours worked, with an error correction. Using that model, savings in 2020 should have been around 80 billion euros, with the difference up to the 108 million euros actually saved constituting the level of non-precautionary forced or surplus savings.
[2] Taking fourth-quarter 2020 data: 95% of the jobs lost compared to a year earlier were workers with low qualification levels; 9% of all people with low qualifications lost their job, compared to 0.2% of those with medium- or high-level qualifications; and 42% of the people on furlough came from the hospitality sector, where salaries are 40% below the average.
References
Bank of Spain (2021). Results of non-financial corporations to 2020 Q4: preliminary year-end data. Economic Bulletin 2/2021.
Retrievable from: https://repositorio.bde.
es/bitstream/123456789/15752/1/be2102- art10e.pdf
María Jesús Fernández. Funcas
Spain’s business demographics post-COVID-19: An initial
assessment
While the effect of COVID-19 on Spanish business demographics has been unprecedented, it has also been unequal, with certain sectors hit harder or recovering faster than others.
For this reason, any economic recovery plan should consider the needs and vulnerabilities of specific sectors.
Abstract: Although previous crises have had adverse effects on business volume indicators and corporate dynamism, the extent to which COVID-19 has impacted Spanish businesses is unprecedented. For example, business turnover in the first few months of the pandemic contracted by nearly twice as much as during the financial crisis. In terms of corporate dynamism, there was an average year-on-year reduction in the number of net new businesses of 72% in April 2020. However, closer analysis
reveals that some sectors have been hit harder than others, with the subsequent recovery speeds also differing across industries. While the manufacturing industry contracted for 15 consecutive months during the financial crisis, it has sustained a relatively rapid recovery in turnover during the COVID-19 crisis. Conversely, turnover in the retail sector remains 10% below pre-crisis levels.
Although it is difficult to be more precise, evidence suggests that the positive performance Ramon Xifré
within the retail sector comes from the sale of food and everyday products, while the rest of the retail sector is still struggling with uncertainty and difficulties. That said, manufacturing fared less well in terms of business dynamism, where the number of net new businesses contracted by 20%, slightly less than the 22% registered by the hospitality sector (accommodation and food service activities). These data highlight the need to design economic support measures in accordance with each sector’s trajectory, reality and reasonable outlook.
Introduction
Recent publications have looked at the outlook for the Spanish economic recovery following the COVID-19 crisis (Torres and Fernández, 2021) and the challenge of recapitalising the business sector in Spain (Peña and Guijarro, 2021; Torres, 2021). This paper aims to provide complementary analysis by providing a provisional and approximate diagnosis of the impact of the crisis on the business sector. It therefore builds on earlier business demographic and dynamism studies conducted prior to the onset of COVID-19 (Xifré, 2016, 2019).
Unlike those earlier studies, this paper, constrained by data limitations, is unable to address the situation facing the self- employed, focusing rather on corporate dynamics. The reason is that the January 2021 update of the INE database of business demographic statistics that includes the self- employed segment —DIRCE— is not yet available. As a result, the analysis contained in this paper is based on two other INE sources:
the business turnover index and the net balance of corporations created/destroyed.
We will therefore have to return to the task
of analysing the impact of COVID-19 on the entire business landscape, including self- employed professionals, at a later date.
Business turnover
Exhibit 1 provides the year-on-year change in the business turnover index, corrected for seasonal and calendar effects, for the economy as a whole, the manufacturing sector, the retail sector and other non-financial services. [1]
The exhibit tracks the monthly figures between January 2003 and January 2021.
The following facts emerge over the period:
■ Other than during episodes of crisis, the year-on-year rates of change remained within a range of 10% in either direction for both the economy as a whole and the individual sectors analysed. Year-on-year changes within that range can therefore be considered compatible with the series’
historical stability.
■ The Global Financial Crisis (GFC) (2008- 2010) triggered contractions of varying magnitude in the three sectors: ~10% in other non-financial services; ~20% in retail;
and ~30% in manufacturing.
■Initially, the COVID-19 crisis generated an extraordinarily abrupt and relatively similar contraction in all three sectors, of approximately 40% year-on-year.
■The path to recovery from that initial rout varies significantly from one sector to another and is also diverging from the patterns observed during the GFC.
“ Initially, the COVID-19 crisis generated an extraordinarily abrupt
contraction in other non-financial services, retail and manufacturing
of approximately 40% year-on-year. ”
To study that last development in greater detail, Exhibit 2 provides two monthly series of the same index, similarly adjusted for seasonal and calendar effects, corresponding to the periods following the Global Financial and the COVID-19 crises.
The series are rebased to the last reading prior to each crisis. The first normalised series is rebased to July 2008 = 100 and spans the 15 months until September 2009, while the second series is rebased
to February 2020 = 100 and runs until January 2021 (last reading available).
As shown, the manufacturing industry has scaled a relatively rapid recovery in the wake of the COVID-19 crisis, whereas the financial crisis generated monthly contractions that were sustained throughout the 15 months analysed. In fact, the manufacturing companies’ turnover index has almost recovered in full just 12 months after the onset
-50 -40 -30 -20 -10 0 10 20
2003M01 2003M07 2004M01 2004M07 2005M01 2005M07 2006M01 2006M07 2007M01 2007M07 2008M01 2008M07 2009M01 2009M07 2010M01 2010M07 2011M01 2011M07 2012M01 2012M07 2013M01 2013M07 2014M01 2014M07 2015M01 2015M07 2016M01 2016M07 2017M01 2017M07 2018M01 2018M07 2019M01 2019M07 2020M01 2020M07 2021M01
Exhibit 1 Year-on-year rate of change in the business turnover index, adjusted for seasonality and calendar effects
-50 -40 -30 -20 -10 0 10 20
2003M01 2003M07 2004M01 2004M07 2005M01 2005M07 2006M01 2006M07 2007M01 2007M07 2008M01 2008M07 2009M01 2009M07 2010M01 2010M07 2011M01 2011M07 2012M01 2012M07 2013M01 2013M07 2014M01 2014M07 2015M01 2015M07 2016M01 2016M07 2017M01 2017M07 2018M01 2018M07 2019M01 2019M07 2020M01 2020M07 2021M01
A. General index
B. Manufacturing index
of the COVID-19 crisis (96%). This suggests that a process of reallocation of activity and resources might be taking place within the manufacturing sector by which the strongest, most competitive firms grow while those of smaller size or lower productivity are driven out of the market.
The situation is less positive in the retail sector, where sector turnover remains 10% below pre- crisis levels one year on. In this case it is worth noting that although the available data do not allow for a more in-depth analysis, it is likely that there are significant asymmetries within this sector. It is plausible that the subsector of the
-50 -40 -30 -20 -10 0 10 20
2003M01 2003M07 2004M01 2004M07 2005M01 2005M07 2006M01 2006M07 2007M01 2007M07 2008M01 2008M07 2009M01 2009M07 2010M01 2010M07 2011M01 2011M07 2012M01 2012M07 2013M01 2013M07 2014M01 2014M07 2015M01 2015M07 2016M01 2016M07 2017M01 2017M07 2018M01 2018M07 2019M01 2019M07 2020M01 2020M07 2021M01
Exhibit 1 Year-on-year rate of change in the business turnover index, adjusted for seasonality and calendar effects
Continued
-50 -40 -30 -20 -10 0 10 20
2003M01 2003M07 2004M01 2004M07 2005M01 2005M07 2006M01 2006M07 2007M01 2007M07 2008M01 2008M07 2009M01 2009M07 2010M01 2010M07 2011M01 2011M07 2012M01 2012M07 2013M01 2013M07 2014M01 2014M07 2015M01 2015M07 2016M01 2016M07 2017M01 2017M07 2018M01 2018M07 2019M01 2019M07 2020M01 2020M07 2021M01
C. Retail index
D. Other services index
Source: INE.
sale of food and other daily products is not in particular trouble, but the rest of the retail sector is indeed experiencing difficulties of various intensities.
And the situation in other non-financial services, a classification that includes the hospitality sector, is even more worrying.
Not only was the initial contraction more pronounced, the recovery is also proving far
weaker and slower, presumably due to the specific adverse impact on those sectors of the mobility restrictions necessary to contain the pandemic. One year after the onset of the COVID-19 crisis, turnover remains 20% below pre-crisis levels for other non-financial services. Overall, business revenue remained nearly 10 percentage points (91%) below pre-crisis levels as of January 2021.
0 10 20 30 40 50 60 70 80 90 100
1 2 3 4 5 6 7 8 9 10 11 12 13 14 15
2008-2010 COVID-19
Exhibit 2 Year-on-year rate of change in the business turnover index, adjusted for seasonality and calendar effects (Base year: 2015)
0 10 20 30 40 50 60 70 80 90 100
1 2 3 4 5 6 7 8 9 10 11 12 13 14 15
2008-2010 COVID-19
A. General index
B. Manufacturing index
Trend in the number of corporations To arrive at a more detailed sector-specific picture of business dynamics, Exhibit 3 depicts the year-on-year rates of change in the net number of corporations created (companies set up less those dissolved)
between February 2020 and January 2021.
Distinguishing between the companies’ core businesses yields two markedly different trends, depicted in Exhibits 3.A and 3.B, respectively. Exhibit 3.A represents the sectors that have experienced sustained
0 10 20 30 40 50 60 70 80 90 100
1 2 3 4 5 6 7 8 9 10 11 12 13 14 15
2008-2010 COVID-19
Exhibit 2 Year-on-year rate of change in the business turnover index, adjusted for seasonality and calendar effects (Base year: 2015)
Continued
0 10 20 30 40 50 60 70 80 90 100
1 2 3 4 5 6 7 8 9 10 11 12 13 14 15
2008-2010 COVID-19 C. Retail index
D. Other services index
Note: For the 2008-2010 crisis, the indices are rebased to July 2008 = 100 and for the COVID-19 crisis, they are rebased to February 2020 = 100.
Source: INE.
growth in the net number of new businesses created since the COVID-19 crisis, whereas Exhibit 3.B encompasses the sectors in which the trend remains negative.
The exhibits reveal that the year-on-year reduction in the number of net new businesses in April 2020 was broadly similar across all sectors, with an average decrease of 72%.
“ The year-on-year reduction in the number of net new businesses in April 2020 was broadly similar across all sectors, with an average decrease of 72%. ”
-100%
-80%
-60%
-40%
-20%
0%
20%
40%
60%
80%
100%
120%
Agriculture Retail Transportation Information Prof. activities
2020M02 2020M03 2020M04 2020M05 2020M06 2020M07
2020M08 2020M09 2020M10 2020M11 2020M12 2021M01
Exhibit 3 Year-on-year rate of change in net business creation by core business sector
Percentage
-100%
-80%
-60%
-40%
-20%
0%
20%
40%
60%
Manufacturing Construction Accommodation and food service
activities
Real estate Admin. activities Other service activities
2020M02 2020M03 2020M04 2020M05 2020M06 2020M07
2020M08 2020M09 2020M10 2020M11 2020M12 2021M01
A. Sectors registering net business creation post-COVID-19
B. Sectors registering net business destruction post-COVID-19
Source: INE.
There is some divergence from this trend, with the manufacturing (63%), professional activities (65%) and agricultural sectors registering relatively smaller reductions, and hospitality (81%) and other non-financial services (83%) at the other end of the spectrum.
It is also worth noting that net business creation fell in all sectors in March 2020 and in most sectors (all except administrative and professional activities), the number of businesses had already fallen in February 2020 (by 11% on average). The January 2020 figures are not included in the exhibit as the manufacturing sector experienced a sharp year-on-year contraction (144%), which would distort the analysis. This was the biggest decline in the sector since 2013 and one for which it is hard to find a natural explanation.
Despite the similarities among sectors before and during the height of the crisis, the trends begin to diverge during the ensuing months.
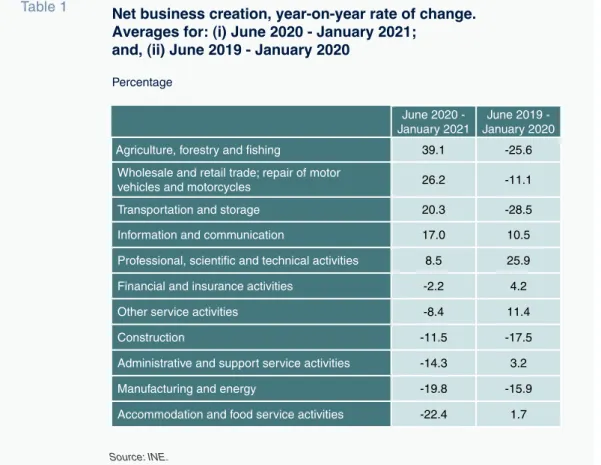
In the sectors represented in Exhibit 3.A, net business creation has been positive, year-on- year, virtually every month between June 2020 and January 2021. As shown in Table 1, the sector experiencing the most dynamic pace of net business creation during the second half of 2020 was the primary sector (39%), followed by the retail sector (26%).
Conversely, in the sectors depicted in Exhibit 3.B the business destruction dynamic has continued during the months since the initial impact of the COVID-19 crisis. Revisiting Table 1, the worst-performing sectors —in terms of the year-on-year averages between June 2020 and January 2021— were hospitality (22%) and manufacturing (20%). The list of sectors that have continued to register net business destruction is rounded out by the construction, real estate, financial & insurance and other service activities.
Table 1 Net business creation, year-on-year rate of change.
Averages for: (i) June 2020 - January 2021;
and, (ii) June 2019 - January 2020
Percentage
June 2020 - January 2021
June 2019 - January 2020
Agriculture, forestry and fishing 39.1 -25.6
Wholesale and retail trade; repair of motor
vehicles and motorcycles 26.2 -11.1
Transportation and storage 20.3 -28.5
Information and communication 17.0 10.5
Professional, scientific and technical activities 8.5 25.9
Financial and insurance activities -2.2 4.2
Other service activities -8.4 11.4
Construction -11.5 -17.5
Administrative and support service activities -14.3 3.2
Manufacturing and energy -19.8 -15.9
Accommodation and food service activities -22.4 1.7
Source: INE.
To put the variability in sector patterns into longer-term context, Table 1 also provides the same rates of change 12 months earlier, i.e., between June 2019 and January 2020.
Exhibit 4 depicts Table 1 graphically and enables a comparison between the average changes in both periods.
The data allow us to group the sector trends into different categories.
■First, we have a group of sectors with business creation dynamics that are proving similar before and since the COVID-19 crisis. The manufacturing and construction activities have been experiencing sustained business destruction for some time. In the case of telecommunication and information management, the ongoing dynamic is one of net new business creation. Real estate
activities constitute a case apart: although the trend has reverted (from net creation to net destruction), the magnitude of the change is scantly significant quantitatively.
■The second category includes a mixed bag of sectors in which business creation dynamics have improved considerably since the crisis.
It includes the agriculture, transportation and retail sectors, where the year-on-year average rates of net business creation have gone from being very negative before the crisis to being very positive since.
In agriculture and transportation, the differences between the two periods are particularly eye-catching, with gains of 65 and 48 percentage points, respectively.
■Lastly, there are four areas of activity in which business creation dynamics have
“ The hospitality sector has gone from average year-on-year rates of business creation of 2% to a reduction of over 22% as a result of the crisis. ”
-40%
-30%
-20%
-10%
0%
10%
20%
30%
40%
50%
June 2020 - January 2021 June 2019 - January 2020
Exhibit 4 Average year-on-year rate of net business creation by period
Percentage
Source: INE.
clearly deteriorated since the crisis:
professional activities; other non-financial service activities; administrative and support service activities; and accommodation and food service activities. In the last three sectors, net business creation was increasing before the crisis and has fallen sharply in its aftermath, with the hospitality sector standing out for the magnitude of its decimation. This sector has gone from average year-on-year rates of business creation of 2% to a reduction of over 22%.
Conclusion
This paper provides an approximate and provisional snapshot of COVID-19’s impact on business volume indicators and dynamism and explores differences across sectors, comparing those impacts with the previous crisis and pre-COVID trends.
In terms of business turnover, the adverse impact of the COVID-19 crisis is without precedent, with the initial fallout roughly twice as large as the initial impact of the GFC. Nevertheless, the recovery in certain sectors, including manufacturing, has been relatively swift and far more intense than was seen in the wake of the financial crisis. The trend in revenue in other service activities, a category that includes the hospitality sector, is, unfortunately, far less encouraging, with turnover remaining below 80% of pre-crisis levels.
In terms of business dynamics, the available figures relate only to corporations and do not include the self-employed. It is possible to clearly single out three areas in which business dynamism has improved since the crisis:
agriculture; retail trade; and transportation.
Although it is very probable that the improvement observed reflects momentum in the wake of such a sharp initial contraction,
some sectors have been registering net positive year-on-year growth in new businesses for eight months in a row. At the other end of the spectrum lie the construction, manufacturing and hospitality sectors, in which business destruction has continued in the aftermath of the crisis. In the hospitality sector, the change in trend is pronounced, with the sector having posted net new business creation prior to the pandemic.
The joint interpretation of the business turnover and business creation readings points to polarisation of the business landscape, both across and within sectors. Based on the data at hand, which run until January 2021, it is clear that some sectors, such as agriculture and transportation, are recovering vigorously from the crisis. The crisis has decimated the hospitality sector and the sub-sectors most reliant on it, with unpredictable consequences.
The current state and perspectives for the manufacturing sector look mixed: there is a contraction in the number of new enterprises created but a significant recovery in this sector’s turnover. This observation is compatible with a process of concentration of economic activity and labour in those manufacturing companies that are more competitive. In th