This project attempts to create a DEM of comparable accuracy using open source satellite sensor imagery and online mapping services. I would like to thank all the people and organizations who helped make this project possible.
INTRODUCTION
STUDY AREA AND MATERIALS
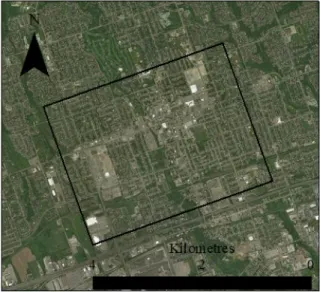
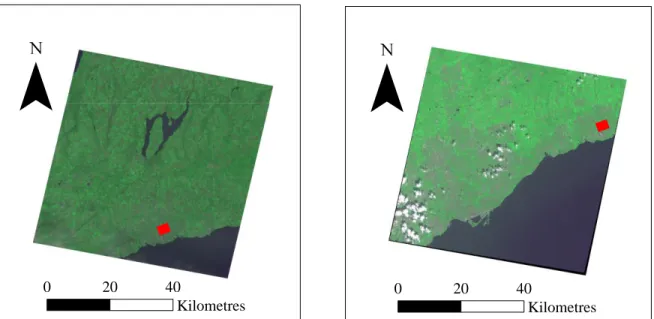
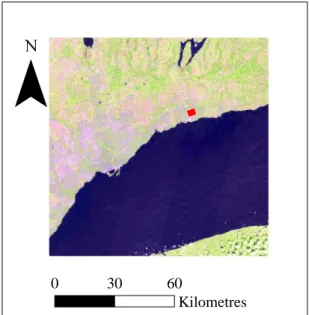
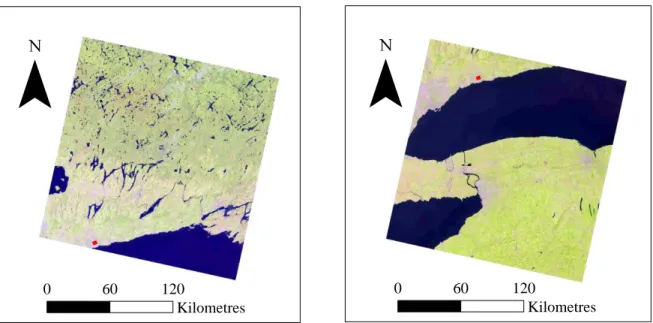
Study Area
Images
- Aerial Images
- Landsat 8 Images
- ASTER Images
- Sentinel Images
- Bing Maps Images
The external orientation parameters of the images were obtained using Applanix GNSS and IMU sensors. The two Landsat 8 images were not stereo pairs because they were taken from the same path with a push broom sensor.
Ontario Ministry of Natural Resources Digital Elevation Model
The service is similar to the online mapping services offered by Google, with the difference that they use aerial images instead of satellite imagery, as in the case of Google. The resolution of the images retrieved from Bing Maps was variable depending on the scale at which the image was displayed, i.e. at small scale (zoomed in) the image would cover a large spatial area and be represented by the number of pixels available per screen, resulting in a coarse spatial resolution.
However, for a large (magnified) scale, the image would cover a small spatial area but appear with the same number of pixels, resulting in a better spatial resolution.
METHODOLOGY
- Image Selection
- Preparation of Digital Elevation Models
- Accuracy Assessment
- Differenced Digital Elevation Models
All DEMs were created using Agisoft's photogrammetric software PhotoScan, except for the DEMs created using aerial photographs, which were made with ERDAS Imagine. The positions of the two images are then determined by a triangulation process, which allows the connection points to also be assigned a spatial reference. Also, the user is allowed to select the quality level and depth filtering level with which the dense cloud will be generated.
Also, the Landsat 8 Multispectral images, ASTER images, Sentinel image and Bing Maps images were converted to grayscale when processed in combination with any of the Landsat 8 Panchromatic images, which appear in grayscale. The software follows a similar process to PhotoScan, but requires that the external orientation of the images be known. The results of the processes produced DEMs with a spatial coverage equal to that of the overlap of the image pair used to generate it.
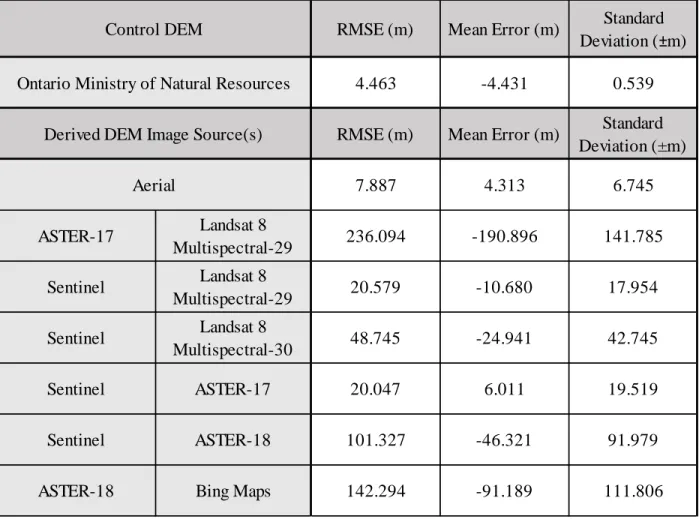
The accuracy of the DEM was investigated by determining the root mean square error (RMSE) of the DEM against the twenty-five ground control points listed in Appendix, Table 4. Where 𝑧𝑖 is the elevation from the generated DEM to the control point location, 𝑍𝑖 is the control point elevation, and 𝑒̅ is mean error. For this reason, elevation errors associated with the DEM were compared visually, as performed by Rayburg et.
RESULTS
Generated Digital Elevation Models
The resolutions of the resulting DEMs are relatively close to the resolution of the images that were used to create them, except in the case of aerial photography. This is due to the 8 pixel sampling interval chosen in the processing as described in the methodology. The spatial resolutions of the remaining DEMs are all close to or equal to those of the coarser resolution image in the pair used to generate them.
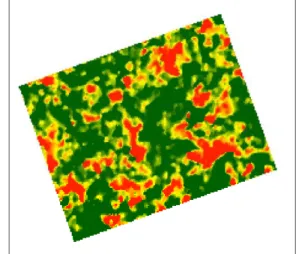
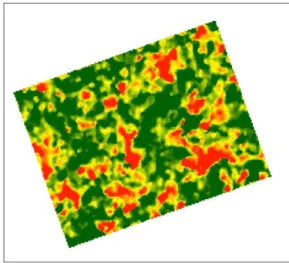
This is the case for all but the DEM created using Landsat 8 Multispectral-29 and Sentinel, which has a spatial resolution of 20.00 m, which is the same as the spatial resolution of Sentinel, the better-resolution image of the pair. Apart from this example, the resulting spatial resolutions are almost identical to the coarse resolution image used to create them. All DEMs in Figure 6 are shown at the same elevation scale indicated at the top of the figure, along with the Ontario Ministry of Natural Resources control DEM.
The DEMs are shown on the same height scale, indicated at the top, along with the. In the case of the DEM generated from aerial photographs, there were no stereo pairs for certain regions, meaning the DEM has no data in those regions. Furthermore, in the case of the DEM generated with the ASTER-18 and Bing Maps images, PhotoScan was not able to generate connection points over the entire study area, which also means that there are regions without data.
Accuracy Assessment Results
However, this level of error is quite high given the 0.07 m spatial resolution of the aerial images. The cause for this is attributed to the fact that lower processing standards were used in the generation of this DEM due to computational limitations. In the case of the Sentinel and ASTER-17 DEM, the RMSE of 20.047 m was generated using 20 m and 15 m image spatial resolutions, respectively.
And in the case of the Sentinel and Landsat 8 Multispectral-29 DEM, the RMSE of 20.579 m was generated using 20 m and 30 m spatial resolutions, respectively. In the case of the Sentinel and Landsat 8 Multispectral-30 DEM, the RMSE of 48,745 m is equivalent to less than two 30-meter pixels from the Landsat 8 image (plus less than three 20-meter Sentinel pixels). And in the case of the Sentinel and ASTER-18 DEM, the RMSE of 101.327 m measured about five 20-meter Sentinel pixels (otherwise, about seven 15-meter ASTER pixels).
In the case of ASTER-17 and Landsat 8 Multispectral-29 DEM, the high level of error can potentially be attributed to incorrect detection and location of matched points between images. This is potentially due to the large difference in spatial resolution between the two images, with the ASTER image having a resolution of 15 m and Landsat 8 having a resolution of 30 m. In the case of ASTER-18 and Bing Maps DEM, the spatial resolution matched closely at 15 m for the ASTER image and 13 m for the Bing Maps image.
Differenced Digital Elevation Model Results
The clearest case of this is with the aerial images, which failed to generate DEMs with every other image. The aerial images have a spatial resolution of 0.07 m, which is very different from the satellite images, where the ASTER images have the closest spatial resolution of 15 m. The observation that similar spatial resolutions between images may also explain why the Sentinel image successfully were able to generate DEMs with each of ASTER and Landsat 8 multispectral imagery.
This is evident in the case of Landsat 8 panchromatic images, with 15 m spatial resolution, which failed to generate DEMs with ASTER imagery and Sentinel imagery, or 15 m and 20 m spatial resolutions, respectively. The clearest example of this is the failure of Panchromatic Landsat 8 imagery to generate any DEM when paired with other imagery. Panchromatic Landsat 8 imagery has a spatial resolution of 15 m, exactly that of ASTER imagery, and similar to that of Sentinel imagery (20 m), however it failed to generate DEM.
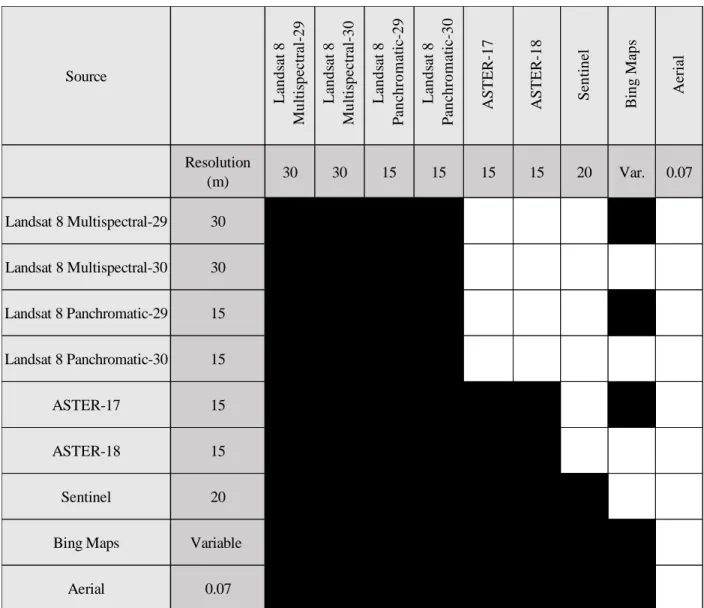
Although the spatial resolutions were kept similar to those of the image with which it was merged. Of the possible twenty-seven DEMs, seven were successfully generated and twenty failed. Successfully generated DEMs had spatial resolutions roughly equal to the coarse-resolution pairwise images used to generate them.
DISCUSSION
Effects of Resolution on Digital Elevation Models
In addition to the seven DEMs that were generated, there were twenty possible image pairs that failed to generate a DEM. Any DEM generated unsuccessfully failed the feature detection stage of the process, meaning that common features between the images were not found. This meant that the features appeared very differently in the two images, so the feature detection algorithm was unable to produce match points between the images.
This was likely due to the images taken at different times of the year, or due to the patchiness of the aerial images or the different radiometric corrections applied to the Bing Maps images prior to publication. Large differences in spatial resolutions may also explain why Landsat 8 Multispectral imagery with 30 m spatial resolution failed to produce a DEM with ASTER-18, Landsat 8 panchromatic imagery, and aerial imagery, all of which have spatial resolution of 15 m or less. And when Landsat 8 Multispectral-29 managed to create a DEM with ASTER-17, it produced the highest RMSE value of 236.094 m.
This suggests that for successful DEM generation, the difference in the spatial resolution of the used image should not exceed 15 m or should remain within 10 m. These results yielded the best RMSE values for DEMs generated from open source images. However, cases were observed where similar or exact spatial resolutions between image pairs failed to produce a DEM.
Effects of Radiometry on Digital Elevation Models
This is thought to be due to the difference in radiometry between the images, and is discussed in the next section. And as also discussed, the radiometry of the images used must also be similar, and is essential for DEM generation. The images from Bing Maps appear to have undergone some form of radiometric correction, and are likely also the cause of the failure at the feature detection stage.
A more detailed investigation into the types and effects of radiometric equalization is discussed by Du et al. To do this, images from ASTER, Landsat 8, Sentinel-2 and Bing Maps were used in pairs to generate DEMs over Oshawa, Canada. This was true for all DEMs generated, except the one generated using Landsat 8 Multispectral-29 and Sentinel, which had a spatial resolution of 20 m, corresponding to that of the finer resolution Sentinel image and not the coarser image, Landsat 8 (30m).
The lowest RMSE values of all generated DEMs were 20.047 m and 20.579 m, obtained by combining images from the Sentinel-2 satellite with images from the ASTER and Landsat 8 sensors, respectively. It was found that DEMs could be generated with relatively high accuracy when the difference between the resolutions of image pairs was within 10 m. This turned out to be the reason that the Landsat 8 Low Intensity, High Contrast Panchromatic images, although comparable in spatial resolution to other images, did not generate DEMs.
Elevation accuracy has been found to be proportional to image resolution, so the use of open-source imagery with a spatial resolution of less than 15 m can potentially exceed the accuracy of open-source DEMs. Comparison and validation of recent freely available digital elevation models ASTER-GDEM ver1, SRTM ver4.1 and GEODATA DEM-9S ver3 over Australia.
CONCLUSION