Segundo Informe sobre Desarrollo Humano en
Centroamérica y Panamá
Capítulo I
Desafío de la equidad social
Inversión en salud para el desarrollo humano: gasto y financiamiento del sector Preparado por Rubén Suarez
HealthSRRCA
Draft December 23, 2002 Section on:
The State of the Region Report:
Investing in Health for Human Development: Health Sector
Expenditures and Financing in Countries of the Region
1Rubén Suarez Regional Advisor Health Economics and Financing Pan American Health Organization [email protected]
A. Investments in Health: National Health Expenditures in countries of the Region: Absolute and relative levels and its composition
Investment in Health: National Health Expenditures across countries Private Households and Government Investments in Health
The external financing of health projects and programs and services
B. The Structure of Health Care Markets, Market Failures and Inequalities in Access to Health Care Services: Public Policy Challenges
Structure of Health Care Markets: scope of market and government failures
Inequalities in Access to Health Care Services
C. Organization and Financing of National Public Health Systems and Social Protection in Health:
The Organization and Financing of National Public Health Systems
Social Protection in Health: Coverage and expenditures of public health insurance programs
The distributive impact of public expenditures in health care services
D. Towards a Regional Integration of National Health Care Systems: Challenges
1
Investing in Health for Human Development: Health Sector Expenditures and Financing in Countries of the Region
A.
Investments in health: National health expenditures in
countries of the region: Absolute and relative levels and its
composition
Investment in health: National health expenditures across countries
The countries of the Region are heterogeneous in terms of the living standard of
the population; as measured by the level of income per capita, HDI, levels of
education, health status and other socioeconomic indicators. They are even
more heterogeneous in terms of the amount of resources invested in health; as
measured by the level of national health expenditures, and in the Public/Private
composition of those expenditures. Large variations in the level national health
care expenditures (NHE), in the importance of NHE as percentage of the Gross
Domestic Product (GDP) and in the public-private composition of national health
expenditures are closely related to different ways in which national health care
systems are organized and financed.
Countries with better health outcomes – life expectancy, maternal mortality and
infant mortality rates and HDI are those in which there is a larger participation of
the public sector in organizing and financing national health care systems. These
are countries in which public expenditures as percentage of the GDP is
significant higher than that of other countries of the region and/or countries with
extended social insurance schemes (coverage of population and services).
Table 1 summarizes the main indicators of national health expenditures in health
care related goods and services (NHE) in countries of the Region. It presents the
population, income per capita, the importance of NHE as percentage of GDP, the
expenditures per dollar of expenditures in public health programs and health care
services by public sector institutions.
Table 1. National expenditures in health care goods and services, selected indicators, 2000 (US$ PPP dollars of 2000; and
percentages) Countries Population 2000 (000) Income Per Capita, In $ PPP
NHE % of GDP
NH, Per capita in US$ Private/Privat e US$ Belice Costa Rica El Salvador Guatemala Honduras Nicaragua Panama 260 4,023 6,276 11,385 6,485 5,071 2,856 5,240 8,250 4,390 3,770 2,390 2,100 5,700 4.8 9.1 8.2 5.4 7.2 11.3 7.3 252 750 360 204 172 237 416 0.92 0.33 1.52 2.60 1.67 1.09 0.35
Region 36,200 4,047 7.6 306 0.9
LAC Region 518,700 7,035 7.3 506 0.9
Source: PAHO – HDP/HDD Database on NHEA-Americas. Health in the Americas 2002 Edition; Volume I. PAHO Scientific and Technical Publications, No. 587; Washington, DC. September 2002.
The Region of Central America and Panama (the Region) accounts for around 7
percent of the population of the Latin America and Caribbean Region (LAC
Region) ant its income per capita of US$ 4,047 dollars is little more than half of
that of the LAC Region (US$ 7,035). The level of income of the country with the
highest income per capita of the region, Costa Rica with US$ 8250 dollars, is 3.9
times the level of income per capita of Nicaragua, the country with the lowest
income per capita, US$ 2100 dollars.
Country’s policy decisions about how to organize and finance national health
care systems, and government decision about investments in human capital are
reflected in the level and composition of national health care expenditures. The
average NHE per capita for countries of the Region is of US$ 306 dollars. The
capita; Costa Rica with a NHE per capita of around US$ 750 dollars, is 4.4 time
the country with the lowest level of NHE per capita; Honduras with a NHE per
capita of US$ 172 dollars.
The NHE as a proportion of the Gross Domestic Product (GDP) and the
public-private composition are indicators of government commitments to address health
related human capital development issues. The NHE/GDP ratio of the Central
America Region is similar to that of the overall LAC region: around 7.6 percent of
the GDP. But this regional average is heavily influenced by the low level of
NHE/GDP of Guatemala, the largest country of the Region in terms of population
and economic significance. With the exception of Belize and Guatemala, in all
other countries of the region the NHE/GDP ratio is around or above the Region’s
average. However, among the countries of the Region, there are substantial
differences in the public-private mix of government expenditures.
Private households and government investments in health
The average household per capita expenditure in health related goods and
services for the Region is estimated in US$ 143 dollars. The average per capita
expenditures in health throughout public sector institutions is of US$ 157.
Households spent US$ 0.91 dollars per dollar spent by public sector institutions.
The ratio private/public health expenditure ratio is an indicator of the dollars
invested in health care related goods and services, pre-paid health plans and
private health insurance schemes by private households per dollar spent or
invested by public sector institutions in government financed health programs
and health care services. A regional average of around one (0.96) indicates that
households as well as government share the burden of the financing of health
sector in more or less equal proportions. However, there are large variations
among countries in the relative importance of public sector involvement in the
ratio is around 0.35 indicates that households spent only US$ 0.33 per dollar
spent by dollar spent by public sector institutions. In Belize and Nicaragua, this
ratio is around one. This private/public ratio contrast with ratios of around 1.5 in
El Salvador and Nicaragua, and with a ratio of US$ 2.6 of private household
expenditures in health services per dollar of public expenditure in health by public
sector institutions in the case of Guatemala.
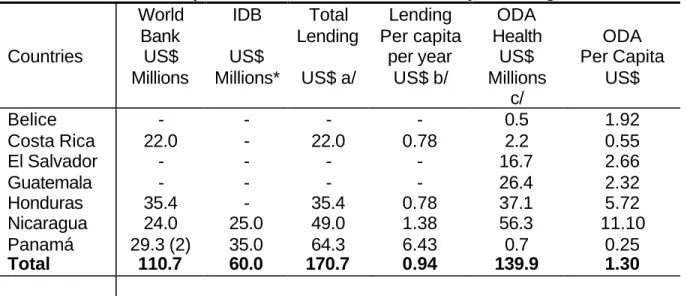
The external financing of health projects and programs and services
The high visibility of health sector projects financed by the World Bank and the
IDB contrasts with the relative importance of resources managed throughout
these projects. The total lending for health sector projects amounted in the year
2001 to a US$ 170 millions. The amount of resources channeled by these
projects; of around 30 millions per year, represents less than 0.43 percent the
annual amount of resources managed by public sector institutions of the Region
(US$ 5,700 millions). The magnitude of resources mobilized throughout Official
Development Assistance for health sector projects and programs is of a greater
importance. In per capita terms, the external financing of health sector projects
represents around one dollar per capita per year (US$ 0.75). The average
amount of ODA resources, during 1998-200, amounted to US$ 110 millions per
year; around US$ 3.8 dollars per capita. The estimated annual public
expenditure per capita is of around US$ 157 dollars (See Table 2).
Lending from international organizations grew substantially during the nineties.
By the end of the year 2001 the portfolio of World Bank and Inter American
Development Bank (IDB) included 7 health sector projects (health, nutrition and
population projects) in 4 countries of the Region (Costa Rica, Honduras,
Nicaragua and Panama) amounted to around US $ 170 millions of dollars. The
World Bank portfolio includes a health sector reform project in Costa Rica,
nutrition and health projects in Honduras and Nicaragua, and a rural health and
accounted for one third of health sector lending (US$ 64.3 millions; two World
Bank projects totaling around US$ 30 millions, and IDB project of US$ 35
millions).
Table 2. Lending for Health Sector Projects financed and Official Development Assistance for Health Projects/Programs; 2000
Countries World Bank US$ Millions IDB US$ Millions* Total Lending US$ a/ Lending Per capita per year US$ b/ ODA Health US$ Millions c/ ODA Per Capita US$ Belice Costa Rica El Salvador Guatemala Honduras Nicaragua Panamá - 22.0 - - 35.4 24.0 29.3 (2) - - - - - 25.0 35.0 - 22.0 - - 35.4 49.0 64.3 - 0.78 - - 0.78 1.38 6.43 0.5 2.2 16.7 26.4 37.1 56.3 0.7 1.92 0.55 2.66 2.32 5.72 11.10 0.25
Total 110.7 60.0 170.7 0.94 139.9 1.30
Source: World Bank and IDB web pages on portfolio of Health, Nutrition and Population projects.
*/ Projects approved during 2001, only.
a/ Most of the projects were of a duration of seven years. Two IDB projects in Panama are of duration of 5 years one and of 3.5 years the other. It does not include time delays in the implementation of projects.
b/ Annualized rate assuming a life of the projects of five years. c/ Average 1998-2000.
B.
The structure of health care markets, market failures and
inequalities in access to health care services: Public policy
challenges
Structure of health care markets: Scope of market and government failures
A relatively large participation of private expenditures in countries characterized
by large income-expenditure inequalities is likely to replicate existing
services, the existence of externalities, economies of scale and information
asymmetries suggest that market solution will lead to a level and composition of
expenditures that are sub optimal from a social welfare perspective (Market
failures). Contrary to the case of the health care markets in more developed
countries, where public expenditures is the main component of national
expenditures, in most countries of the Region there is relatively large private
markets. The lack of public policies addressing market failures suggests large
inefficiencies in the observed level and composition of national health care
expenditures.
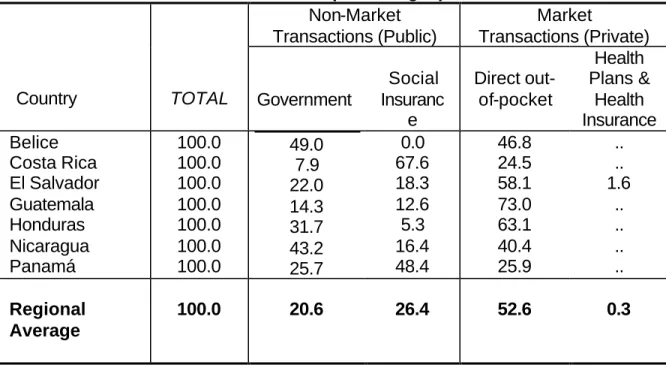
Table 3 shows the large heterogeneity of the market structures and public policy
challenges faced by policy makers in addressing efficiency and inequality issues.
This table presents a description of the structure of health care markets in terms
of the expenditures in health care related goods and services by central and local
governments, the expenditures in maternal and health programs throughout
social insurance schemes; non-market transactions (public), and private
out-pocket expenditures in health related goods and services and their expenditures
in pre-paid health plans and health insurance schemes; market transactions
Table 3. The structure of health care markets in countries of the region: Market and non-market transactions (composition; in
percentages)
Non-Market Transactions (Public)
Market
Transactions (Private)
Country TOTAL Government
Social Insuranc e Direct out-of-pocket Health Plans & Health Insurance Belice Costa Rica El Salvador Guatemala Honduras Nicaragua Panamá 100.0 100.0 100.0 100.0 100.0 100.0 100.0 49.0 7.9 22.0 14.3 31.7 43.2 25.7 0.0 67.6 18.3 12.6 5.3 16.4 48.4 46.8 24.5 58.1 73.0 63.1 40.4 25.9 .. .. 1.6 .. .. .. .. Regional Average
100.0 20.6 26.4 52.6 0.3
Not available estimates. Source: Table A.2; Annex.
For the region as whole the direct participation of the government in the provision
of health care services is relatively minor, it represents around one fifths of
overall national health expenditures in health related goods and services (20.6
percent). More significant is the amount of resources channeled throughout
social insurance schemes managed by national social security institutions. NHE
throughout public health insurance schemes represents one fourth of national
health expenditures (26.4 percent). Direct out-of-pocket expenditures are the
main components of national health care expenditures in all countries of the
Region; it represents more than half of the total (52.6 percent). The two
exceptions are the cases of Costa Rica and Panama. In all other countries direct
out-of pocket expenditures accounts for at least 40 percent of national health
care expenditures
Private markets are relatively larger in countries with relatively low levels of
income: El Salvador, Guatemala and Honduras. They accounts for more than 60
goods and services are the single most important component of total health
expenditure. Significance of resources spent in pre-paid health plans and private
health insurance schemes is relatively minor. The relatively low significance of
central government expenditures in health and the lack of regulatory policies to
deal with market failures affecting the market transactions suggest that there is
ample room for implementing public policies to correct inefficiencies associated
to the type of market failures characterizing this markets.
Inequalities in Access to Health Care Services
Inequalities in access to health care services can be measured by the differences
in the level of expenditures in health related goods and services by different
socio economic group and by the relative importance of household expenditures
in health related goods and services and private health insurance. Table 4
summarizes the inequalities in private out-of-pocket expenditures in selected
countries of the Region. The table presents the share of household out-of-pocket
expenditures as percentage of total household resources (income or level of
consumption) by different income groups.
The countries of the Region are characterized for having relatively large income
distribution inequalities. In almost all the countries of the Region the top 20
percent of the income distribution, the richest quintile, concentrates more than 46
percent of national income. Data on the share of household expenditure in health
related goods represents between 3.0 percent in the case of Panama (in
1983-84) to 5.4 in the case of El Salvador (in 1999). No time series data exists on
changes over time in the share of households out-of-pocket expenditures.
Empirical evidence from both, developed and developing countries, suggest that
private household expenditures may have been increasing over time. An income
elasticity of health expenditures greater than one, and greater availability and
newly introduced medical services and medicines may be contributing to a
services. The increase in private out-of-pocket expenditures may be more
significant in which public sector play a minor role in the provision of health care
services. The case of Guatemala may be an example. In the period between the
early eighties and the late nineties, the share of expenditures in health related
goods and services increased from 1.64 percent in 1979/81, to 4.5 percent in
1998/99. Similar trends have been observed in other countries of the LAC
Region.
Table 4. Inequalities in access to health service indicators: Household out-of-pocket expenditures by income quartiles; selected countries and
years.
Quartiles of income/expenditure
Countries Year
National Average
(%) Q1 Q2 Q3 Q4
Belize
Costa Rica a/ El Salvador a/ b/ Guatemala a/ Nicaragua a/ Panama a/ 1987-88 1999 1999 1979-81 1998-99 1998-99 1983-84 3.70 5.37 1.00 1.64 4.50 4.41 3.04 2.15 n.a. 0.22 1.32 3.76 5.75 0.86 2.56 n.a. 0.56 1.71 4.40 4.98 0.89 3.22 n.a. 1.37 2.24 4.70 4.75 2.32 4.54 n.a. 3.45 1.32 5.80 4.04 3.54
Region c/ 3.9 3.2 3.2 3.7 4.5
LAC Region c/ 4.3 3.6 3.9 4.3 4.9
a/ Household out-of-pocket-expenditures as percentage of household income/expenditures.
b/ Index of household per capita expenditures in health related goods and services, national average = 1.00 (C$ 159).
c/ Average of latest available years.
Inequalities in access to health care services are more pronounced than income
inequalities. In most countries of the Region the share of household
expenditures in health related goods and services increase as income increases
(income elasticity of household expenditures in health is greater than one). For
the Region it increased from 3.2 percent of the income of the poorest quartile, to
4.5 percent of the household income of the richest quartile. The index of
household per capita expenditures in health related goods and services from El
Salvador illustrate the large inequalities in the levels of expenditures between the
bottom and top quartile of the income distribution. The average per capita
expenditure of the top quartile is more than three times the national average. The
lowest quartile is approximately one fifth the national average. The average level
of expenditure of the top quartile is more than 15 times the average level of
expenditures of the lowest quartile, the 25 percent poorest (The average
expenditure of the top decile is more than 20 times the one of the bottom decile).
C.
Organization and financing of national public health
systems and social protection in health:
The organization and financing of national public health systems
The structure of health care markets in countries of the Region, and the
inequalities in access just described are due, in a large part, to the degree of
government involvement in organizing the provision and financing of national
health care systems. Governments may intervene directly; throughout the
organization and financing of national health care systems, and indirectly;
through the setting up of statutory public health insurance schemes and the
regulation of the private markets (goods and services and health insurance
markets). The countries of the Region are rather heterogeneous in terms of the
configuration of their national health care systems and in the importance of the
In the Region there are the three types of systems commonly used in typifying
the organization and financing of health care systems. The health care system of
Belize may be characterized as a national health care service system (NHS); a
system in which the government plays a dominant role in the financing and
provision of health care services, directly. Costa Rica and Panama can be
characterized as national health insurance systems (NHIS), systems in which
financing and access to health care services is throughout a national health
insurance systems. The health care systems of El Salvador, Honduras,
Guatemala and Nicaragua can be characterized as market oriented or mixed
national health care systems (MNHS). Access to health care services is financed
by direct out-of-pocket expenditures. The amounts of resources (expenditures)
managed by government institutions (Ministries of Health) and the expenditure
and coverage of social (public) health insurance schemes is relatively minor.
Social protection in health: Coverage and expenditures of public health insurance programs
Degree of government involvement in the provision of social services may be
assessed by the absolute and relative amount of resources spent in health care
services and by the percentage of population covered. Table shows the large
variations in the importance of the public sector in the provision of health care
services in countries of the Region and in the scope of social protection
throughout public health insurance schemes managed by social security
Table 5. Social protection in health: Coverage and expenditures
throughout public health insurance programs; 2000-2001 n.a.: Not applicable
a/ Estimates for 2000; includes insured and beneficiaries (dependents) b/ Estimates for 2001; includes insured and beneficiaries (dependents)
Source: PAHO – HDP/HDD Database on NHEA-Americas. Health in the Americas 2002 Edition; Volume I. PAHO Scientific and Technical Publications, No. 587; Washington, DC. September 2002. Ministerio de Salud, República de Nicaragua, Cuentas Nacionales en Salud, Informe 1995-2001, División General de Planificación y Desarrollo, Managua, Nicaragua, Diciembre 2002.
Around 8.2 millions of persons; out of the 36.2 millions of inhabitants of the
Region, are beneficiaries of health insurance programs managed by social
security institutions. It represents less than one fourth of the total population
(22.6 percent). More than 50 percent of the beneficiaries are concentrated in the
two countries, Costa Rica and Panama, the countries of the Region with most
comprehensive social insurance systems.
Among countries of the region there are large variations in the percentage of
population covered by public health insurance programs as well as in the benefits
received, measured by the level of per capita health expenditure per beneficiary.
In El Salvador, Honduras, Guatemala and Nicaragua, less than 15 percent of the Countries Population Covered by Public Health insurance (000) Coverage: % of the Total Populatio n Health Expenditure s Social Health Insurance Systems % of GDP
Health Expenditur e Per capita; (Per beneficiary) US$ PPP Governme nt Health Expenditur e
% of GDP
Governme nt Health Expenditur e Per capita (Total Population) US$ PPP Belice Costa Rica El Salvador Guatemala Honduras Nicaragua b/ Panama n.a. 2,810.0 941.4 1,646.0 607.0 402.5 1770.0 n.a. 73.6 15.0 14.0 9.4 7.7 60.0 n.a 6.1 1.5 0.7 0.4 1.8 3.6 n.a 720.5 439.2 182.5 102.1 476.8 331.1 2.5 0.6 1.8 0.8 2.3 3.6 1.9 131.1 49.5 79.1 30.2 54.9 75.6 108.3
population is covered by social health insurance schemes. In Nicaragua, only 7.7
percent of the total population is cover. It contrasts with the coverage of 60 and
more than 70 percent of the population in the cases of Panama and Costa Rica.
Variations across countries in the significance of expenditures as percentage of
the GDP and in the level of expenditures per beneficiary indicates the variations
of the benefits received by the beneficiaries of social insurance programs in
different countries of the Region. The share of health expenditures by social
insurance programs varies from a high level of 6.1 percent of the GDP in the
case of Costa Rica, to less than 0.4 percent in the case of Honduras. The level of
expenditure per beneficiary in Honduras is of around US$ 102 dollars with an
average expenditure per beneficiary of US$ 720 dollars in the case of Costa
Rica.
The distributive impact of public expenditures in health care services
The Distribution of the benefits of government expenditures in health care
related goods and services is pro-poor in the case of Costa Rica; around 27
percent of the benefits of public expenditures is received by the 20 percent
poorest quintile of the income distribution. Government expenditures in health
were found to be pro-rich in the cases of Guatemala and Nicaragua. The richest
20 percent of the population received 25 percent of the benefits in the case of
Nicaragua and 31 percent in the case of Guatemala. In the case of Honduras
Table 6. Distribution of benefits of government expenditures on health indicators: Countries of region and average for
the Latin America and the Caribbean
Sources: Suarez-Berenguela, R. Health Systems Inequalities in Latin America and the Caribbean, in Investment in Health: Social and Economic Returns; Scientific and Technical Publications No. 582. Pan American Health Organization, 2001. CEPAL. Equidad, desarrollo y ciudadanía; Versión definitiva; Comisión Económica para América Latina -CEPAL; Santiago, Chile, Agosto, 2000; Panorama Social de América Latina, 2000-2001; CEPAL, Santiago, Chile, 2001. Corbacho, A. and Davoodi, H. Expenditure Issues and Governance in Central America; IMF Working Paper (WP/02/187); Internacional Monetary Fund, Washington DC, November 2002.
* Estimates reported in Suarez-Berenguela, R. (2001) p. 142.
* * Estimates from CEPAL (CEPAL, 2000; CEPAL 2001). Quintiles, by level of income per capita. It includes government expenditures in Health and Nutrition.
*** Estimates reported in Corbacho and Davoodi (2002). P.21.
**** Estimates from Trejos (2000) reported in Picado, G. Gasto y Financiamiento de la Salud en Costa Rica: Situación actual, tendencies y retos (Versión Preliminar; 20/12/2002). Ministerio de Salud, Organización Panamericana de la Salud.
a/ Unweighted average using CEPAL estimates for 8 countries of the LAC region. - : Data not available.
Large variations in the distributive impact of government expenditures in health
care services and public health programs suggest that there in most countries of
the region there is an ample room for improving the use of government
expenditure as a tool for achieving a more equitable access to health care
services. Data presented in this paper suggest that governments of countries of
the Region, particularly those in low- income countries, have the potential to use
more effectively existing fiscal tools to address health and equity issues:
Q1 Q2 Q3 Q4 Q5
Costa Rica; 1986* Costa Rica, 1990 *** Costa Rica, 2000 ****
Guatemala; 1998/99*
Honduras, 1990 *** Nicaragua, 1990 ***
Average LAC a/**
Increasing the level of expenditures in health programs and health care services
throughout public sector institutions, and improving the distributive impact of
those expenditures.
D.
Towards a regional integration of national health care
systems: Challenges
Large differences among countries of the Region in the absolute and relative
levels of national health expenditures in health care related goods and services,
in the public-private mix of those expenditures, and in the way in which national
health care systems are organized and financed posses a enormous challenges
for harmonization of social policies in countries of the Region. These differences
in the characteristics of health care markets in the different countries of the
Region are only a reflection of the government commitments to address health
and human development issues. Regardless of the reasons, there are marked
differences in health status outcomes and scope of social protection programs,
and on the use of government policies to address equity concerns.
Costa Rica and Panama are the two countries with the highest level of
investment in health (and other forms of human capital such as education and
training), with the most extensive scope of health insurance-social protection
programs are the countries with better health outcomes. Also they are the
countries of the Region with the fastest rate of economic growth, the only
countries in which the long term rate of economic growth is above the average of
countries of the LAC region.
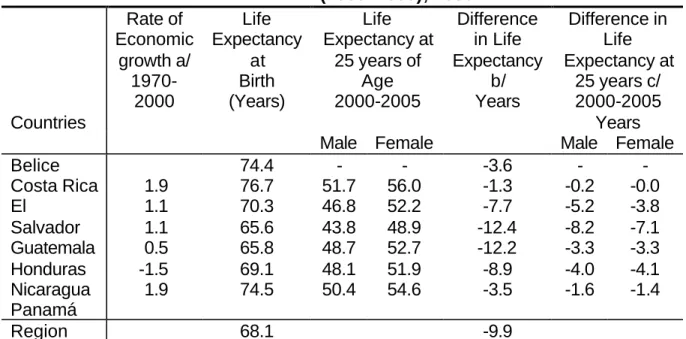
Table 7 summarizes the life expectancy at birth and life expectancy of the
population of 25 years of age. Also, it shows the difference in life expectancy
among countries at birth and at 25 years of age for the period 2000-2005.
age are indicators of well being as well as of the duration of the investments in
human capital.
Table 7. Economic growth and longevity of human capital: Life expectancy at birth and life expectancy at 25 years of age
(2000 -2005); 2000
Countries Rate of Economic growth a/ 1970-2000 Life Expectancy at Birth (Years) Life Expectancy at
25 years of Age 2000-2005 Difference in Life Expectancy b/ Years Difference in Life Expectancy at
25 years c/ 2000-2005
Years
Male Female Male Female
Belice Costa Rica El Salvador Guatemala Honduras Nicaragua Panamá 1.9 1.1 1.1 0.5 -1.5 1.9 74.4 76.7 70.3 65.6 65.8 69.1 74.5 - 51.7 46.8 43.8 48.7 48.1 50.4 - 56.0 52.2 48.9 52.7 51.9 54.6 -3.6 -1.3 -7.7 -12.4 -12.2 -8.9 -3.5 - -0.2 -5.2 -8.2 -3.3 -4.0 -1.6 - -0.0 -3.8 -7.1 -3.3 -4.1 -1.4
Region 68.1 -9.9
a/ Average rate of growth of the income per capita of the population. a/ Life Expectancy of 78 years used as reference.
b/ Reference of 52 years of life expectancy for men and 56 years for women. Sources: OPS Health Indicators, 2002. CELADE; Boletin Demográfico
The large difference in the living conditions and health status of the population of
countries of the Region presents a major challenge for ensuring an equitable
distribution of the gains from economic growth and for harmonization of social
policies. The quality and longevity of human capital is one of the most important
constraints for ensuring long term sustainable economic growth. Health of the
population, the quality and longevity of human capital is one of the most
important constraints for ensuring long term economic growth. Differences in
morbidity and mortality rates, is a proxy variable to assess the quality and
longevity of human capital. Longer life expectancy allows longer periods of
accumulation of physical and human capital and allows intergenerational
transfers of knowledge, skills. Also, it allows longer period of time over which the
accumulated (investments in early child development programs, education,
occupational skills, etc.).
Many countries of the Region are making a limited use of public policy
instruments to improve health outcomes and to achieve a more equitable access
to health care services. Level of public investments in health, in absolute terms
and as percentage of the GDP, is lower than one observed in countries that once
had similar level of income but achieved greater level of health, human
development and economic growth. Low income countries of the Region are
lagging behind in terms in the rate of investments in health and human
development. The level of public expenditure as percentage of GDP of the last
20 years, since 1980, have been less than half of that of the countries with the
better health outcomes, and with more extensive social protection systems.
Large variations in the distributive impact of government expenditures in health
care services and public health programs suggest that there is an ample room for
improving the distributive impact of government expenditures in health.
Government of the countries of the Region have the potential to use more
effectively existing public policy (fiscal) tools for increasing the level of investment
in health and human development and to improve the distributive impact of those