CONTINENTAL BIAS IN TRADE
SALVADOR GIL-PAREJA RAFAEL LLORCA-VIVERO
JOSÉ ANTONIO MARTÍNEZ SERRANO
FUNDACIÓN DE LAS CAJAS DE AHORROS DOCUMENTO DE TRABAJO
Nº 440/2009
De conformidad con la base quinta de la convocatoria del Programa de Estímulo a la Investigación, este trabajo ha sido sometido a eva- luación externa anónima de especialistas cualificados a fin de con- trastar su nivel técnico.
ISSN: 1988-8767
La serie DOCUMENTOS DE TRABAJO incluye avances y resultados de investigaciones dentro de los pro- gramas de la Fundación de las Cajas de Ahorros.
Las opiniones son responsabilidad de los autores.
1
CONTINENTAL BIAS IN TRADESalvador Gil-Pareja Rafael Llorca-Vivero*
José Antonio Martínez Serrano
Abstract:
This paper investigates the potential existence of a continental bias in world trade flows.
Using the Helpman, Melitz and Rubinstein two-stage estimation procedure on a sample of 182 countries over the period 1990-2006, we find evidence of an economically significant
continental bias. A continent-by-continent analysis reveals that countrieslocated in Asia, Oceania, America and Europe can be considered natural trading partners, whereas this is not the case for Africa. For the latter, results suggest that the relationship between inter and intra-continental trade costs is relatively low, although this fact seems to revert over the last years.
Key words: Continental bias, gravity equation, intercontinental and intra-continental
trade costs.
JEL classification: F14.
* University of Valencia,
[email protected]2
1. IntroductionSince the path-breaking paper by McCallum (1995), there has been a notable academic interest in researching the so-called border effect, that is, the negative impact of national borders on trade flows. Using the gravity equation, McCallum found that trade among Canadian provinces exceeded province’s trade with US states by more than a factor of 20. Subsequent studies have investigated the size of the home bias across space and time, documenting that international borders strongly diminish trade. Among the likely causes of the border effect are national trade barriers (tariffs, quotas, exchange rate variability, regulatory differences, etc.), as they generate additional transaction costs for inter- versus intra-national shipments.
1The goal of this paper is to investigate the possible existence of a continental
bias in trade, in a similar fashion to the home bias, based on differences in trade costsbetween and within continents. These differences have been considered by the economic geography literature in the context of the theoretical welfare analysis of preferential trade agreements (PTAs). In particular, the relationship between intra- continental and intercontinental trade costs is a central element of the hypothesis of
"natural" trading partners with clear welfare implications.
2With zero intercontinental transport costs, continental PTAs decrease welfare (Krugman, 1991a). With prohibitive intercontinental transport costs, such agreements increase welfare (Krugman, 1991b).
However, in the intermediate realistic case where intercontinental transportation costs are neither zero nor prohibitive (but greater than transportation costs within continents) the relationship between intercontinental and intra-continental transportation costs determines the net impact of PTAs on welfare (Frankel, Stein and Wei, 1993, 1995 and 1996). If there is a positive continental bias in trade, countries located on the same continent can be considered “natural” trading partners and therefore preferential trade
1 Despite technological progress in transport and communications and negotiated reductions in trade barriers, market segmentation continues to exist and political boundaries shape the geographical pattern of trade. See, among others, Helliwell (1996, 1997, 1998), Wei (1996), Anderson and Smith (1999a, 1999b), Nitsch (2000), Head and Mayer (2000), Helliwell and Verdier (2000), Hillberry (2002), Anderson and van Wincoop (2003), Evans (2003), Okubo (2003), and Chen (2004), Gil et al (2005), Gil, Llorca and Martínez-Serrano (2006).
2 The literature on the economic determinants of the formation of PTAs also explicitly considers intercontinental and intra-continental transportation costs among multiple countries on multiple continents (see, for example, Baier and Bergstrand, 2004 and Egger and Larch, 2008).
3 agreements among them are more likely to be welfare-improving.
3On the contrary, the evidence of a negative continental bias in trade would suggest that continental preferential agreements may be welfare decreasing. Continental trading blocs that reduce welfare are called "super-natural".
4In particular, this paper aims at answering two main questions. First, all other things equal, countries on the same continent trade more with each other than countries located on different continents? That is, is there a continental bias in trade? Second, are there differences in the size and sign of the continental bias across continents? To the best of our knowledge, there is no study in the literature that has tried to investigate the possible existence of a continental bias in trade.
5In order to explore continental bias in trade we estimate gravity equations following the two-stage estimation procedure recently proposed by Helpman, Melitz and Rubinstein (2008). This framework allows us to correct for selection bias and to account for exporter heterogeneity. The sample covers 182 countries over the period 1990-2006.
To preview our results, we find a positive continental bias for Asia, Oceania, America and Europe. Africa is a peculiar case. The results for the African continent reveal a negative continental bias suggesting that intra-continental trade costs are not relatively lower than intercontinental ones. However, some changes are observed over time if the analysis is carried out by sub-periods.
The paper is structured as follows. Section 2 presents the methodology. Section 3 describes the data. Section 4 discusses the estimation results. Finally, section 5 concludes the paper.
3 The term natural trading partner goes beyond pure distance arguments and, therefore, by transport costs we refer to any kind of trade costs.
4 Frankel Stein and Wei (1993, 1995 and 1996) set up a trade theory model of many countries that are grouped into continents with high trade costs across continents and low costs within them. According to these authors the term "super-natural" refers to a continental PTA that is welfare-reducing on net due to relatively low intercontinental transportation costs.
5 Frankel, Stein and Wei (1993) also draw the boundaries at continental bloc level, but they do not consider all the countries in each continent. In their paper the continents are The Americas (including only 13 countries), the European Community (11 countries) and East Asia (10 countries).
4
2. MethodologyThe gravity equation of trade is considered to be one of the most successful empirical frameworks in international economics. It relates bilateral trade flows to economic size (GDP), distance and other factors that affect trade barriers.
6In particular, the literature on the border effect has made use of the gravity equation to estimate the size of the home bias in trade. In this paper, we also use that methodology to assess the existence and magnitude of the continental bias.
The typical gravity equation estimated in the border effect literature can be written as follows:
70 1 2 3 4
ln
ijln
iln
jln
ij ijij
Trade G D P G D P D ist H om e
O thercontrols u
β β β β β
= + + + +
+ +
(1)
where
Tradeijis the bilateral trade flow from i to j,
GDPiand GDP
jare the gross domestic products, Dist
ijdenotes the distance between i and j,
Homeijis a dummy variable that takes the value of one for trade flows within countries and zero otherwise, and Othercontrols are a set of variables that are included to capture variation in various trade costs, such as binary variables for the presence of a land border, a common language or being a member of the same trade agreement. In this set-up, the border
effect is measured by the estimated coefficient of the dummy variable Home.Despite being used in many studies on the border effect, equation (1) is likely to be mis-specified owing to ignoring theoretical foundations for the gravity equation. As Anderson and van Wincoop (2003) emphasize (in the context of the border effect literature) the gravity model theory implies that one must take into account the role of relative prices ("multilateral resistance", in Anderson and van Wincoop terminology).
8The usual solution to the presence of such multilateral resistance is to include country
6 Initially the gravity model lacked theoretical foundation. However, since the end of the 1970´s the situation has changed and nowadays the gravity model is backed up by sound theory. See, among others, Anderson (1979), Bergstrand (1985 and 1989), Deardoff (1998), Evenett and Keller (2002), and Anderson and van Wincoop (2003).
7 In the equations we have omitted the subscript "t" referring to time for simplicity.
8 While the methodological contribution of Anderson and van Wincoop (2003) is made trying to provide a "solution" to the border puzzle, it is indeed important for the proper estimation of gravity equations in other applications of the international trade literature.
5 fixed effects (for both the exporter and the importer countries) when estimating gravity equations.
9More recently, Helpman, Melitz and Rubinstein (2008) (henceforth HMR) have developed a theoretical model that generalizes the Anderson and van Wincoop (2003) framework in two ways. Firstly, they account for non-observable firm heterogeneity and fixed trade costs in line with the so-called new-new trade theory (Melitz, 2003).
Secondly, they account for asymmetries in the volume of bilateral exports between countries depending on the direction of export flows (from i to j versus from j to i).
Moreover, they also develop the empirical framework for estimating the gravity equation derived in their model.
In this paper we use the two-stage estimation procedure proposed by HMR (2008). In the first stage we estimate a probit equation that specifies the probability that country
i exports to j conditional on the observable variables. In the second stage,predicted components of this equation are used to estimate the gravity equation. This procedure simultaneously corrects for two types of potential biases: a Heckman selection bias and a bias from potential asymmetries in the trade flows between pairs of countries.
More formally, in a first stage we estimate a probit equation of the type:
Prob T( ij =1/observedvariables)= Φ( , ,χ λi j Xij,Zij, )εij
(2) where T
ijis an indicator variable equal to 1 when country i exports to j and zero when it does not, Φ is the cumulative distribution function of the standard normal distribution, χ
iand
λjare exporter and importer fixed effects, X
ijare variables which affect both the probability and the volume of trade, and Z
ijrepresents variables that are used for the exclusion restriction, that is, those that affect the probability of observing a positive volume of trade but do not impact the volume of trade if this were to be positive.
10We include in
Xijthe log of bilateral distance between countries as well as
9 Following Anderson and van Wincoop (2003 and 2004) and Feenstra (2004), many recent studies include country fixed effects in the estimation of gravity equations for international trade flows. See, among others, Klein and Shambaugh (2006), Baier and Bergstrand (2007) and Gil, Llorca and Martinez- Serrano (2008a, 2008b).
10 In this set-up, parameter identification requires the existence of a variable that affects the probability of observing a non-zero flow between two countries but not the volume. Alternatively, a variable which affects both decisions in opposite directions would also work.
6 dummy variables used as controls in the standard gravity equation, such as the presence of a land border, of islands in the pair, of a landlocked country in the pair, of a common language, of colonial ties, of a previously common country and common membership in a preferential trade agreement. Finally, in order to estimate the continental bias we additionally include a dummy variable (SameCont) that takes the value of one for trade flows between countries located on the same continent and zero otherwise. If the fact that two countries belong to the same continent increases the probability of trade between them, the estimated coefficient should be positive and statistically significant.
Using the probit regression, we construct two variables that are included as regressors in the second stage estimation. One is the inverse of Mills ratio and the other is an expression that controls for firm size heterogeneity. In particular, the second stage consists in the estimation for a given year of the following non-linear equation for all country-pairs with positive trade flows:
{ }
* * *
lnTradeij =β0 +λj +χ γi− Xij+θηij +ln exp⎡⎢⎣δ(z$ij+ηij)⎤⎥⎦− +1 εij
(3)
where
η*ijis the inverse Mills ratio and
z$*ij = Φ−1(ρij)in which ρ
ijare the estimates from the probit equation.
11If the trading relations between countries on the same continent are stronger than those between countries located on different continents, then the estimated coefficient of SameCont would be positive and statistically significant.
3. Data
The trade data for the dependent variable (export flows from country i to country
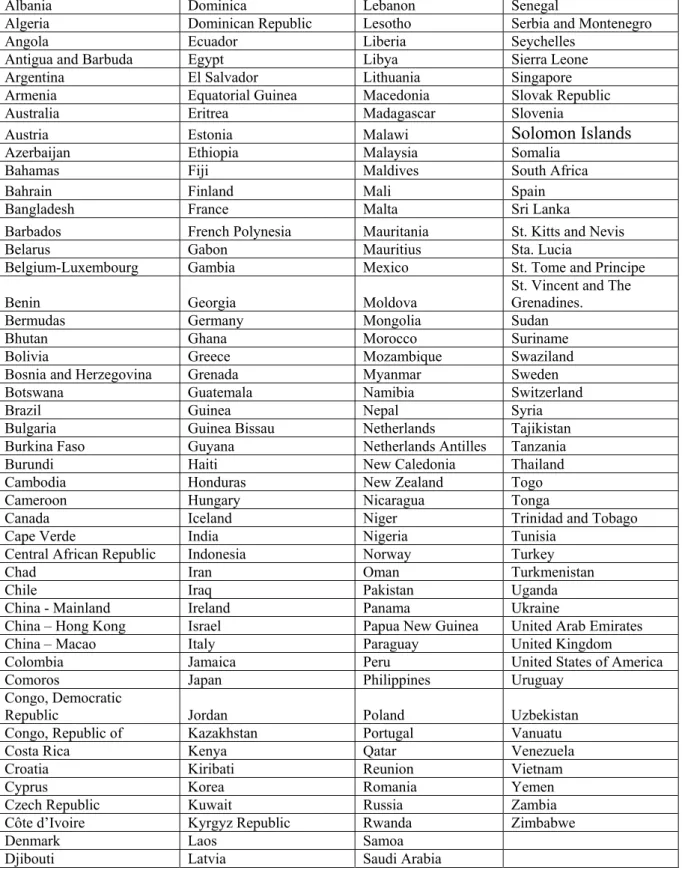
j) come from the “Direction of Trade” (DoT) dataset built up by the InternationalMonetary Fund (IMF). The data comprise bilateral merchandise trade between 182 countries and territories (see Table A1) over the period 1990-2006.
12The DoT dataset provides FOB exports in US dollars. These series are converted into constant terms
11 Since equation (3) is non-linear in δ, following HMR (2008) we estimate it using maximum likelihood.
12 It is noteworthy that not all the areas considered are countries in the conventional sense of the word.
We also include some dependencies, territories and overseas departments in the data.
7 using the American GDP deflator taken from the Bureau of Economic Analysis (US Department of Commerce).
The independent variables come from different sources. GDP data in constant US dollars are taken from the World Development Indicators (World Bank). When data were unavailable from this source, the Penn World Table (University of Pennsylvania) and International Financial Statistics (IMF) were used. For location of countries (geographical coordinates), used to calculate Great Circle Distances, and the construction of the dummy variables for physically contiguous neighbours, island and landlocked status, common language, colonial ties and common country background data are taken from the CIA's World Factbook. The indicators of preferential trade agreements, have been built using data from the World Trade Organization, Preferential Trade Agreements Database (The Faculty of Law at McGill University) and the web site http://ec.europa.eu/trade/issues/bilateral/index_en.htm. More specifically, the sample includes 202 preferential trade agreements (multilateral and bilateral).
134. Empirical results
We begin by estimating the continental bias in trade without taking into account the existence of preferential trade agreements. The estimated equations include exporter and importer fixed effects as well as year dummies. The results for the probit regression are presented in column 1 of Table 1.
14Before discussing the empirical results, it is worth noting that the estimation of equation (2) might be subject to the incidental parameter problem and introduce a bias in the coefficients of the rest of variables (X
ijand Z
ij). However, as pointed out by Fernández-Val (2007), this bias does not affect the estimated marginal effects and, therefore, the predicted values obtained for the dependent variable. The estimated marginal effects are, in general, economically and statistically significant with sensible interpretations. More distant countries are less
13 The list of preferential trade agreements considered is available from the authors upon request. The expression PTAs in this paper refers also to other agreements involving a higher degree of economic integration. In fact, most economic integration agreements considered in the sample are free trade agreements.
14 Following HMR (2008) we also have country pairs whose characteristics are such that their probability of trade is indistinguishable from 1. Therefore, we assign the same z$*ij to those country pairs with an estimated ρ*ij > 0.9999999.
8 likely to trade. In a similar way, the existence of a landlocked country in the pair reduces the probability of a trade link. On the contrary, we find that sharing a common border, a common language, colonial ties and being islands or part of the same country in the past increase the probability of trade.
In the gravity equation framework, if there was nothing to the notion of
continental bias, then a dummy variable capturing whether two countries are bothlocated on the same continent ought not to be statistically significant. However, as we show in this paper, this is not the case. In column 1, the estimated coefficient of the variable of interest is positive and statistically significant suggesting that being on the same continent raises the probability of bilateral trade.
Using the probit regression, as explained before, we construct two variables for correcting sample selection bias and firm heterogeneity. Both the non-linear coefficient
δ and the linear coefficient forη
*ijare precisely estimated. The results for the second stage can be seen in column (2) of Table 1. The variable language has been excluded from the estimation for identification reasons (see the methodological section). The estimated coefficients show that the same determinants that affect the probability of bilateral exports also impact bilateral export volumes. At this stage, we once again find a positive and significant coefficient for the continental bias dummy variable. In particular, the estimated coefficient is 0.293 which suggests that two countries located on the same continent trade approximately 34% more than two identical countries located on different continents.
As an important feature of the recent wave of economic integration among countries has been the proliferation of preferential trade agreements along continental lines, trade policy may contribute to the existence of a border effect at the continental level. Therefore, in columns (3) and (4) we control for the existence of PTAs around the world. Somewhat surprisingly, despite the estimated coefficient of PTAs being positive and statistically significant, the inclusion of this variable has little effect on the magnitude of the coefficient of interest. Therefore, other factors different from preferential trade agreements are behind the continental bias.
In order to analyze the evolution of the continental bias across time we have
split the sample period into two sub-periods 1990-98 and 1999-2006. Results are
reported in Table 2. From this analysis, some differences emerge with respect to the
estimated coefficients of the variable of interest in both stages. Being part of the same
9 continent affects much more the probability of trading for the sub-period 1990-1998 than in the early 2000s. On the contrary, once countries trade the estimated coefficient for continental bias for the sub-period 1999-2006 doubles that for the first sub-period, suggesting a deepening in the process of regionalization.
We now turn to the analysis of continental bias by continent. To do so, the
SameCont dummy variable is replaced by continent-specific dummies so that fivecoefficients (one for each continent) are estimated. The results are reported in Table 3.
Column (1) and (2) present the results for the full sample period (1990-2006). On the one hand, the first stage estimation reveals that for Africa, America and Oceania the probability of trade between a pair of countries within these continents is positive, whereas this is not the case for Asia and Europe. For Asia the coefficient is negative although it is not statistically significant at conventional levels. For Europe the estimated coefficient is negative and statistically significant at the 1 per cent level. The result for Europe suggests that countries in this continent are relatively more open to the rest of the world than countries in the other continents.
On the other hand, the second stage results indicate that with the exception of Africa, every continent presents positive and statistically significant coefficients at the 1 per cent level except for Oceania (at the 10 per cent level). In particular, the point estimate of 0.658 for Asia (column 2) implies that when two countries of a pair belong to that continent, they trade 93 per cent as much [exp(0.658)-1=0.931] as would two other similar countries. The estimates for The Americas show that when two countries are both in the Western Hemisphere, their bilateral trade is 51 per cent [exp(0.414)- 1=0.513] higher than it would be otherwise. A similar result is found for Oceania [exp(0.430)-1=0.537]. Finally, Europe shows the smaller continental bias [exp(0.244)- 1=0.276]. Thus, in these four continents, the relationship between intra-continental trade costs versus intercontinental trade costs favours trade along continental lines. This suggests that countries in these continents can be considered natural trading partners.
However, for Africa the coefficient for continental bias is -0.112 and is statistically significant at the 10 per cent level. In this case, the result suggests that intra-continental transportation costs are relatively high if we compare with the rest of the continents.
This evidence may be explained by several factors, such as, little complementarities and
high trading costs among African economies, unfavourable geographical conditions,
inappropriate transport policies or poor transport facilities (Yang and Gupta, 2005).
10 Taking together the results of the two stages of the estimation procedure, we find that countries in the Old Continent have a greater probability of engaging in trade with countries in other continents than countries in Africa, America and Oceania. However, once trade takes place within European countries they also show a continental bias in trade as show countries in Asia, America and Oceania. In other words, these four continents display a positive continental bias in trade. However, Africa is clearly a peculiar case, being the estimated coefficient of the variable of interest negative.
When we split the whole sample period into two sub-periods (1990-98 and 1999-2006), the most relevant change relates to Africa. The corresponding coefficient is negative and significant (at the 1 per cent level) in the period 1990-98. However, for the period 1999-2006, the coefficient is not statistically significant at conventional levels.
This result suggests a slight process of regionalization in international trade in this continent. Behind it there could be improvements in infrastructure and trade facilitation in recent years.
5. Conclusions
The recent literature about the welfare implications of PTAs clearly shows the relevance of the relationship between inter and intra-continental transportation costs. In this literature, natural trading partners are those located in the same continent whereas unnatural partners are those located on different continents. Moreover, to the extent that intercontinental costs were sufficiently low, natural partners may become "super- natural" making the corresponding PTAs welfare decreasing.
In this paper, we account for recent developments in the theoretical foundations
of the gravity equation to estimate for the first time the possible existence of continental
bias in trade. Using a two-stage estimation procedure on a sample of 182 countries overthe period 1990-2006 we find a positive continental bias for the cases of Asia, Oceania,
America and Europe. Thus, countries on these continents can be considered natural
trading partners. Africa is a peculiar case. This continent shows a negative continental
bias over the full sample period considered. This is probably a consequence of the highintra-continental trade costs in this continent that may be an obstacle to mutually
beneficial intra-continental trade flows. However, some differences are observed if the
analysis is carried out by sub-periods. In the 1990s, the results reveal the existence of a
highly negative continental bias in Africa. Notwithstanding, it seems that changes in
11
this respect have occurred over the first few years of the 21
stcentury, where there is no
evidence of continental bias in Africa.
12
ReferencesAnderson JE. A theoretical foundation to the gravity equation. American Economic Review 1979;69; 106-16.
Anderson MA, Smith S. Do national borders really matter? Canada-US regional trade reconsidered. Review of International Economics 1999a;7; 219-27.
Anderson MA, Smith S. Canadian provinces in world trade: engagement and detachment. Canadian Journal of Economics 1999b;32; 22-38.
Anderson JE, van Wincoop E. Gravity with gravitas: A solution to the border puzzle.
American Economic Review 2003;93; 170-92.
Anderson JE, van Wincoop E. Trade Costs. Journal of Economic Literature 2004;42;
691-741.
Baier SL, Bergstrand JH. Economic determinants of free trade agreements. Journal of International Economics 2004;64; 29-63.
Baier SL, Bergstrand JH. Do free trade agreements actually increase members' international trade? Journal of International Economics 2007;71; 72-95.
Bergstrand JH. The gravity equation in international trade: some microeconomic foundations and empirical evidence. Review of Economics and Statistics 1985;67; 474- 81.
Bergstrand, JH. The generalised gravity equation, monopolistic competition, and the factor proportions theory in international trade. Review of Economics and Statistics 1989; 71; 143-53.
Chen N. Intra-national versus international trade in the European Union: Why do national borders matter? Journal of International Economics 2004; 63; 93-118.
Deardoff AV 1998. Determinants of bilateral trade: does gravity work in a neoclassic world? In: Frankel J (Ed) The Regionalization of the World Economy, Chicago:
University of Chicago Press; 1998.
Egger P, Larch M. Interdependent Preferential trade agreement memberships: An empirical analysis. Journal of International Economics forthcoming..
Evans CL. The economic significance of national border effects. American Economic Review 2003;93;1291-312.
Evenett SJ, Keller W. On theories explaining the success of the gravity equation.
Journal of Political Economy 2002;110;281-316.
13 Feenstra R. Advanced Internacional Trade: Theory and Evidence. Princeton: Princeton University Press; 2004.
Fernández-Val I.. Fixed effects estimation of structural parameters and marginal effects in panel probit models. Department of Economics: Boston University; 2007.
Frankel J, Stein E, Wei SJ. Continental trading blocs: Are they natural, or super-natural.
National Bureau of Economic Research Working Paper 4588; 1993.
Frankel J, Stein E, Wei SJ. Trading blocs and the Americas: The natural, the unnatural, and the super-natural. Journal of Development Economics 1995;47; 61-95.
Frankel J, Stein E, Wei S. J. Regional trading arrangements: Natural or super-natural.
American Economic Review Paper and Proceedings 1996;86; 52-56.
Gil-Pareja S, Llorca-Vivero R, Martínez-Serrano JA, Oliver-Alonso J. The border effect in Spain. The World Economy 2005;28; 1627-631.
Gil-Pareja S, Llorca-Vivero R, Martínez-Serrano JA. The border effect in Spain: The Basque Country case. Regional Studies 2006;40; 335-345.
Gil-Pareja S, Llorca-Vivero R, Martínez-Serrano JA. Trade effects of monetary agreements: Evidence for OECD countries. European Economic Review 2008a;52; 733- 755.
Gil-Pareja S, Llorca-Vivero R, Martínez-Serrano JA. Assessing the enlargement and deepening of the European Union. The World Economy 2008b;31; 1253-1272.
Head K, Mayer T. Non-Europe: The magnitude and causes of market fragmentation in the EU. Weltwirtschaftliches Archiv 2000; 136; 284-314.
Helliwell JF. Do national borders matter for Quebec’s trade. Canadian Journal of Economics;29; 507-22.
Helliwell, JF. National borders, trade and migration. Pacific Economic Review 1997;1;
165-85.
Helliwell, JF. How much do national borders matter? Washington D.C: Brookings Institution Press; 1998.
Helliwell JF, Verdier G. Measuring internal trade distances: A new method applied to estimate provincial border effects in Canada. Canadian Journal of Economics 2001;34;
1024-41.
Helpman E, Melitz M, Rubinstein Y. Estimating trade flows: trade partners and trade
volumes. Quarterly Journal of Economics 2008; 123; 441-487.
14 Hillberry RH. Aggregation bias, compositional change, and the border effect. Canadian Journal of Economics 2002, 35(3): 517-30.
Klein, MW, Shambaugh J. C. Fixed exchange rates and trade. Journal of International Economics 2006;70; 359-383.
Krugman, P 1991a. Is bilateralism bad? In: Helpman E, Razin A (Eds), International Trade and Trade Policy, Cambridge, MA: MIT Press; 1991.
Krugman, P 1991b. The Move Toward Free Trade Zones. In: Policy Implications of Trade and Currency Zones. Symposium sponsored by the Federal Reserve Bank of Kansas City: Jackson Hall, WY; 1991. p. 7-42.
McCallum J. National borders matter: Canadian-U.S. regional trade patterns. American Economic Review1995;85; 615-23.
Melitz, MJ. The impact of trade on intra-industry reallocations and aggregate industry productivity. Econometrica 2003;71; 1695-1725.
Nitsch V. National borders and international trade: Evidence from the European Union.
Canadian Journal of Economics 2000;33; 1091-105.
Okubo, T. The border effect in the Japanese market: A gravity model analysis. Journal of the Japanese and International Economies 2004;18; 1-11.
Wei S. Intra-national versus international trade: How stubborn are nations in global integration? National Bureau of Economic Research Working Paper 5531; 1996.
Yang Y, Gupta, S.. Regional trade arrangements in Africa: Past performance and the
way forward. African Development Review 2008;19; 399-431.
15
Table A1: Sample of countries.
Albania Dominica Lebanon Senegal
Algeria Dominican Republic Lesotho Serbia and Montenegro
Angola Ecuador Liberia Seychelles
Antigua and Barbuda Egypt Libya Sierra Leone
Argentina El Salvador Lithuania Singapore
Armenia Equatorial Guinea Macedonia Slovak Republic
Australia Eritrea Madagascar Slovenia
Austria Estonia Malawi
Solomon Islands
Azerbaijan Ethiopia Malaysia Somalia
Bahamas Fiji Maldives South Africa
Bahrain Finland Mali Spain
Bangladesh France Malta Sri Lanka
Barbados French Polynesia Mauritania St. Kitts and Nevis
Belarus Gabon Mauritius Sta. Lucia
Belgium-Luxembourg Gambia Mexico St. Tome and Principe
Benin Georgia Moldova St. Vincent and The
Grenadines.
Bermudas Germany Mongolia Sudan
Bhutan Ghana Morocco Suriname
Bolivia Greece Mozambique Swaziland
Bosnia and Herzegovina Grenada Myanmar Sweden
Botswana Guatemala Namibia Switzerland
Brazil Guinea Nepal Syria
Bulgaria Guinea Bissau Netherlands Tajikistan
Burkina Faso Guyana Netherlands Antilles Tanzania
Burundi Haiti New Caledonia Thailand
Cambodia Honduras New Zealand Togo
Cameroon Hungary Nicaragua Tonga
Canada Iceland Niger Trinidad and Tobago
Cape Verde India Nigeria Tunisia
Central African Republic Indonesia Norway Turkey
Chad Iran Oman Turkmenistan
Chile Iraq Pakistan Uganda
China - Mainland Ireland Panama Ukraine
China – Hong Kong Israel Papua New Guinea United Arab Emirates
China – Macao Italy Paraguay United Kingdom
Colombia Jamaica Peru United States of America
Comoros Japan Philippines Uruguay
Congo, Democratic
Republic Jordan Poland Uzbekistan
Congo, Republic of Kazakhstan Portugal Vanuatu
Costa Rica Kenya Qatar Venezuela
Croatia Kiribati Reunion Vietnam
Cyprus Korea Romania Yemen
Czech Republic Kuwait Russia Zambia
Côte d’Ivoire Kyrgyz Republic Rwanda Zimbabwe
Denmark Laos Samoa
Djibouti Latvia Saudi Arabia
16 Table 1. HMR two-stage estimation of continental bias. Sample period 1990-2006
(1) (2) (3) (4)
Variables Probit coefficient
Marginal effect
ML Probit coefficient
Marginal effect
ML
Ln Dist
ij-0.656 (0.014)
***-0.214 (0.005)
***-0.630 (0.046)
***-0.629 (0.015)
***-0.205 (0.005)
***-0.612 (0.043)
***Contiguity
ij0.253 (0.077)
***0.076 (0.021)
***0.767 (0.080)
***0.202 (0.077)
***0.062 (0.022)
***0.742 (0.079)
***Island
ij0.443 (0.035)
***0.124 (0.008)
***0.790 (0.088)
***0.442 (0.035)
***0.124 (0.008)
***0.786 (0.087)
***Landlocked
ij-0.591 (0.035)
***-0.203 (0.012)
***-1.276 (0.081)
***-0.587 (0.034)
***-0.201 (0.012)
***-1.292 (0.080)
***Language
ij0.407 (0.020)
***0.120 (0.005)
***0.399 (0.020)
***0.117 (0.005)
***Colony
ij0.231 (0.113)
**0.069 (0.031)
**0.842 (0.092)
***0.243 (0.114)
**0.073 (0.031)
**0.868 (0.092)
***ComCount
ij0.967 (0.119)
***0.209 (0.013)
***1.415 (0.159)
***0.891 (0.119)
***0.199 (0.015)
***1.328 (0.156)
***PTAS
ijt0.190
(0.031)
***0.062 (0.010)
***0.185 (0.037)
***SameCont
ij0.070 (0.020)
***0.023 (0.006)
***0.293 (0.039)
***0.064 (0.020)
***0.020 (0.006)
***0.267 (0.039)
***δ
1.009
(0.073)
***0.967 (0.071)
****
η
ij0.334
(0.072)
***0.318 (0.069)
***No observat.
419,749 255,212 419,749 255,212
Pseudo R
20.43 0.43
Notes:
The regressions include exporter, importer and year fixed effects.
Robust standard errors (clustering by country pair) are in parentheses.
* significant at 10%; ** significant at 5%; *** significant at 1%.
17 Table 2. HMR two-stage estimation of continental bias. Sample periods 1990-1998 and 1999-2006
1990-1998 1999-2006
(1) (2) (3) (4)
Variables Probit coefficient
Marginal effect
ML Probit coefficient
Marginal effect
ML
Ln Dist
ij-0.654 (0.017)
***-0.232 (0.006)
***-0.640 (0.043)
***-0.640 (0.017)
***-0.183 (0.005)
***-0.600 (0.046)
***Contiguity
ij0.217 (0.083)
***0.072 (0.026)
***0.682 (0.086)
***0.145 (0.092)
0.039 (0.023)
*0.832 (0.082)
***Island
ij0.532 (0.042)
***0.162 (0.010)
***0.891 (0.097)
***0.390 (0.038)
***0.095 (0.008)
***0.708 (0.088)
***Landlocked
ij-0.668 (0.043)
***-0.246 (0.016)
***-1.401 (0.091)
***-0.551 (0.038)
***-0.168 (0.012)
***-1.223 (0.079)
***Language
ij0.454 (0.023)
***0.147 (0.007)
***0.371 (0.023)
***0.094 (0.005)
***Colony
ij0.498 (0.135)
***0.151 (0.033)
***0.708 (0.098)
***0.061 (0.121)
0.017 (0.033)
0.969 (0.095)
***ComCount
ij0.997 (0.122)
***0.245 (0.016)
***1.578 (0.170)
***0.877 (0.151)
***0.163 (0.015)
***1.184 (0.161)
***PTAS
ijt0.273
(0.040)
***0.033 (0.008)
***0.252 (0.050)
***0.154 (0.038)
***0.044 (0.011)
***0.166 (0.038)
***SameCont
ij0.096 (0.024)
***0.097 (0.014)
***0.174 (0.045)
***0.043 (0.023)
*0.012 (0.007)
*0.360 (0.039)
***δ
0.909
(0.064)
***0.974 (0.075)
****
η
ij0.369
(0.062)
***0.374 (0.078)
***No observat.
209,639 119,431 210,087 135,781
Pseudo R
20.47 0.42
Notes:
The regressions include exporter, importer and year fixed effects.
Robust standard errors (clustering by country pair) are in parentheses.
* significant at 10%; ** significant at 5%; *** significant at 1%.
18
Table 3. HMR two-stage estimation of continental bias by continent. Sample period 1990-2006
1990-2006 1990-1998 1999-2006
(1) (2) (3) (4) (5) (6)
Variables Probit coefficient Marginal
effect ML Probit
coefficient Marginal
effect ML Probit
coefficient Marginal
effect ML Ln Distij -0.548
(0.017)***
-0.179 (0.005)***
-0.582 (0.044)***
-0.572 (0.020)***
-0.203 (0.007)***
-0.606 (0.044)***
-0.555 (0.020)***
-0.160 (0.006)***
-0.570 (0.047)***
Contiguityij 0.320
(0.077)***
0.094 (0.020)***
0.732 (0.080)***
0.335 (0.084)***
0.109 (0.024)***
0.666 (0.087)***
0.266 (0.091)***
0.068 (0.021)***
0.832 (0.083)***
Islandij 0.413 (0.036)***
0.118 (0.009)***
0.718 (0.090)***
0.497 (0.043)***
0.154 (0.011)***
0.832 (0.099)***
0.366 (0.039)***
0.091 (0.008)***
0.628 (0.089)***
Landlockedij -0.596
(0.034)*** -0.205
(0.012)*** -1.236
(0.081)*** -0.672
(0.043)*** -0.248
(0.016)*** -1.331
(0.091)*** -0.562
(0.037)*** -0.173
(0.012)*** -1.178 (0.080)***
Languageij 0.397
(0.020)*** 0.118
(0.005)*** 0.457
(0.023)*** 0.148
(0.007)*** 0.369
(0.023)*** 0.094 (0.005)***
Colonyij 0.238 (0.112)**
0.072 (0.031)**
0.822 (0.091)***
0.488 (0.176)***
0.150 (0.044)***
0.633 (0.097)***
0.064 (0.121)
0.018 (0.033)
0.940 (0.093)***
ComCountij 0.932 (0.116)***
0.206 (0.014)***
1.255 (0.161)***
1.034 (0.120)***
0.252 (0.016)***
1.468 (0.176)***
0.908 (0.145)***
0.167 (0.014)***
1.126 (0.165)***
PTASijt 0.218
(0.032)***
0.071 (0.010)***
0.226 (0.039)***
0.320 (0.042)***
0.114 (0.015)***
0.347 (0.052)***
0.174 (0.038)***
0.050 (0.011)***
0.189 (0.040)***
Africaij 0.105
(0.028)*** 0.033
(0.009)*** -0.112
(0.065)* 0.085
(0.035)*** 0.029
(0.012)*** -0.261
(0.079)*** 0.120
(0.032)*** 0.033
(0.008)*** 0.013 (0.065)
Americaij 0.503
(0.045)*** 0.138
(0.010)*** 0.414
(0.087)*** 0.537
(0.053)*** 0.164
(0.013)*** 0.384
(0.095)*** 0.501
(0.054)*** 0.117
(0.010)*** 0.460 (0.092)***
Asiaij -0.040
(0.041)
-0.013 (0.014)
0.658 (0.072)***
0.072 (0.047)
0.025 (0.016)
0.679 (0.080)***
-0.148 (0.047)***
-0.045 (0.015)***
0.669 (0.074)***
Europeij -0.187
(0.043)***
-0.064 (0.016)***
0.244 (0.055)***
-0.205 (0.057)***
-0.076 (0.022)***
-0.021 (0.064)
-0.136 (0.052)***
-0.041 (0.016)***
0.427 (0.057)***
Oceaniaij 1.082
(0.124)***
0.222 (0.012)***
0.430 (0.259)*
1.131 (0.134)***
0.267 (0.014)***
0.170 (0.261)
1.050 (0.154)***
0.179 (0.011)***
0.729 (0.277)**
δ 1.040
(0.078)*** 1.001
(0.070)*** 1.031
(0.082)***
*
η
ij 0.320 (0.077)*** 0.395(0.069)*** 0.353
(0.085)***
No observat. 419,749 255,212 209,639 119,431 210,087 135,781
Pseudo R2 0.44 0.47 0.43
Notes: The regressions include exporter, importer and year fixed effects. Robust standard errors (clustering by country pair) are in parentheses.* significant at 10%; ** significant at 5%; ***
significant at 1%.
F
UNDACIÓN DE LASC
AJAS DEA
HORROS DOCUMENTOS DE TRABAJOÚltimos números publicados
159/2000 Participación privada en la construcción y explotación de carreteras de peaje Ginés de Rus, Manuel Romero y Lourdes Trujillo
160/2000 Errores y posibles soluciones en la aplicación del Value at Risk Mariano González Sánchez
161/2000 Tax neutrality on saving assets. The spahish case before and after the tax reform Cristina Ruza y de Paz-Curbera
162/2000 Private rates of return to human capital in Spain: new evidence F. Barceinas, J. Oliver-Alonso, J.L. Raymond y J.L. Roig-Sabaté 163/2000 El control interno del riesgo. Una propuesta de sistema de límites
riesgo neutral
Mariano González Sánchez
164/2001 La evolución de las políticas de gasto de las Administraciones Públicas en los años 90 Alfonso Utrilla de la Hoz y Carmen Pérez Esparrells
165/2001 Bank cost efficiency and output specification Emili Tortosa-Ausina
166/2001 Recent trends in Spanish income distribution: A robust picture of falling income inequality Josep Oliver-Alonso, Xavier Ramos y José Luis Raymond-Bara
167/2001 Efectos redistributivos y sobre el bienestar social del tratamiento de las cargas familiares en el nuevo IRPF
Nuria Badenes Plá, Julio López Laborda, Jorge Onrubia Fernández
168/2001 The Effects of Bank Debt on Financial Structure of Small and Medium Firms in some Euro- pean Countries
Mónica Melle-Hernández
169/2001 La política de cohesión de la UE ampliada: la perspectiva de España Ismael Sanz Labrador
170/2002 Riesgo de liquidez de Mercado Mariano González Sánchez
171/2002 Los costes de administración para el afiliado en los sistemas de pensiones basados en cuentas de capitalización individual: medida y comparación internacional.
José Enrique Devesa Carpio, Rosa Rodríguez Barrera, Carlos Vidal Meliá
172/2002 La encuesta continua de presupuestos familiares (1985-1996): descripción, representatividad y propuestas de metodología para la explotación de la información de los ingresos y el gasto.
Llorenc Pou, Joaquín Alegre
173/2002 Modelos paramétricos y no paramétricos en problemas de concesión de tarjetas de credito.
Rosa Puertas, María Bonilla, Ignacio Olmeda
174/2002 Mercado único, comercio intra-industrial y costes de ajuste en las manufacturas españolas.
José Vicente Blanes Cristóbal
175/2003 La Administración tributaria en España. Un análisis de la gestión a través de los ingresos y de los gastos.
Juan de Dios Jiménez Aguilera, Pedro Enrique Barrilao González 176/2003 The Falling Share of Cash Payments in Spain.
Santiago Carbó Valverde, Rafael López del Paso, David B. Humphrey Publicado en “Moneda y Crédito” nº 217, pags. 167-189.
177/2003 Effects of ATMs and Electronic Payments on Banking Costs: The Spanish Case.
Santiago Carbó Valverde, Rafael López del Paso, David B. Humphrey
178/2003 Factors explaining the interest margin in the banking sectors of the European Union.
Joaquín Maudos y Juan Fernández Guevara
179/2003 Los planes de stock options para directivos y consejeros y su valoración por el mercado de valores en España.
Mónica Melle Hernández
180/2003 Ownership and Performance in Europe and US Banking – A comparison of Commercial, Co- operative & Savings Banks.
Yener Altunbas, Santiago Carbó y Phil Molyneux
181/2003 The Euro effect on the integration of the European stock markets.
Mónica Melle Hernández
182/2004 In search of complementarity in the innovation strategy: international R&D and external knowledge acquisition.
Bruno Cassiman, Reinhilde Veugelers
183/2004 Fijación de precios en el sector público: una aplicación para el servicio municipal de sumi- nistro de agua.
Mª Ángeles García Valiñas
184/2004 Estimación de la economía sumergida es España: un modelo estructural de variables latentes.
Ángel Alañón Pardo, Miguel Gómez de Antonio
185/2004 Causas políticas y consecuencias sociales de la corrupción.
Joan Oriol Prats Cabrera
186/2004 Loan bankers’ decisions and sensitivity to the audit report using the belief revision model.
Andrés Guiral Contreras and José A. Gonzalo Angulo
187/2004 El modelo de Black, Derman y Toy en la práctica. Aplicación al mercado español.
Marta Tolentino García-Abadillo y Antonio Díaz Pérez 188/2004 Does market competition make banks perform well?.
Mónica Melle
189/2004 Efficiency differences among banks: external, technical, internal, and managerial Santiago Carbó Valverde, David B. Humphrey y Rafael López del Paso
190/2004 Una aproximación al análisis de los costes de la esquizofrenia en españa: los modelos jerár- quicos bayesianos
F. J. Vázquez-Polo, M. A. Negrín, J. M. Cavasés, E. Sánchez y grupo RIRAG 191/2004 Environmental proactivity and business performance: an empirical analysis
Javier González-Benito y Óscar González-Benito
192/2004 Economic risk to beneficiaries in notional defined contribution accounts (NDCs) Carlos Vidal-Meliá, Inmaculada Domínguez-Fabian y José Enrique Devesa-Carpio
193/2004 Sources of efficiency gains in port reform: non parametric malmquist decomposition tfp in- dex for Mexico
Antonio Estache, Beatriz Tovar de la Fé y Lourdes Trujillo 194/2004 Persistencia de resultados en los fondos de inversión españoles
Alfredo Ciriaco Fernández y Rafael Santamaría Aquilué
195/2005 El modelo de revisión de creencias como aproximación psicológica a la formación del juicio del auditor sobre la gestión continuada
Andrés Guiral Contreras y Francisco Esteso Sánchez
196/2005 La nueva financiación sanitaria en España: descentralización y prospectiva David Cantarero Prieto
197/2005 A cointegration analysis of the Long-Run supply response of Spanish agriculture to the com- mon agricultural policy
José A. Mendez, Ricardo Mora y Carlos San Juan
198/2005 ¿Refleja la estructura temporal de los tipos de interés del mercado español preferencia por la li- quidez?
Magdalena Massot Perelló y Juan M. Nave
199/2005 Análisis de impacto de los Fondos Estructurales Europeos recibidos por una economía regional:
Un enfoque a través de Matrices de Contabilidad Social M. Carmen Lima y M. Alejandro Cardenete
200/2005 Does the development of non-cash payments affect monetary policy transmission?
Santiago Carbó Valverde y Rafael López del Paso
201/2005 Firm and time varying technical and allocative efficiency: an application for port cargo han- dling firms
Ana Rodríguez-Álvarez, Beatriz Tovar de la Fe y Lourdes Trujillo 202/2005 Contractual complexity in strategic alliances
Jeffrey J. Reuer y Africa Ariño
203/2005 Factores determinantes de la evolución del empleo en las empresas adquiridas por opa Nuria Alcalde Fradejas y Inés Pérez-Soba Aguilar
204/2005 Nonlinear Forecasting in Economics: a comparison between Comprehension Approach versus Learning Approach. An Application to Spanish Time Series
Elena Olmedo, Juan M. Valderas, Ricardo Gimeno and Lorenzo Escot
205/2005 Precio de la tierra con presión urbana: un modelo para España Esther Decimavilla, Carlos San Juan y Stefan Sperlich
206/2005 Interregional migration in Spain: a semiparametric analysis Adolfo Maza y José Villaverde
207/2005 Productivity growth in European banking
Carmen Murillo-Melchor, José Manuel Pastor y Emili Tortosa-Ausina
208/2005 Explaining Bank Cost Efficiency in Europe: Environmental and Productivity Influences.
Santiago Carbó Valverde, David B. Humphrey y Rafael López del Paso
209/2005 La elasticidad de sustitución intertemporal con preferencias no separables intratemporalmente: los casos de Alemania, España y Francia.
Elena Márquez de la Cruz, Ana R. Martínez Cañete y Inés Pérez-Soba Aguilar
210/2005 Contribución de los efectos tamaño, book-to-market y momentum a la valoración de activos: el caso español.
Begoña Font-Belaire y Alfredo Juan Grau-Grau
211/2005 Permanent income, convergence and inequality among countries José M. Pastor and Lorenzo Serrano
212/2005 The Latin Model of Welfare: Do ‘Insertion Contracts’ Reduce Long-Term Dependence?
Luis Ayala and Magdalena Rodríguez
213/2005 The effect of geographic expansion on the productivity of Spanish savings banks Manuel Illueca, José M. Pastor and Emili Tortosa-Ausina
214/2005 Dynamic network interconnection under consumer switching costs Ángel Luis López Rodríguez
215/2005 La influencia del entorno socioeconómico en la realización de estudios universitarios: una aproxi- mación al caso español en la década de los noventa
Marta Rahona López
216/2005 The valuation of spanish ipos: efficiency analysis Susana Álvarez Otero
217/2005 On the generation of a regular multi-input multi-output technology using parametric output dis- tance functions
Sergio Perelman and Daniel Santin
218/2005 La gobernanza de los procesos parlamentarios: la organización industrial del congreso de los di- putados en España
Gonzalo Caballero Miguez
219/2005 Determinants of bank market structure: Efficiency and political economy variables Francisco González
220/2005 Agresividad de las órdenes introducidas en el mercado español: estrategias, determinantes y me- didas de performance
David Abad Díaz
221/2005 Tendencia post-anuncio de resultados contables: evidencia para el mercado español Carlos Forner Rodríguez, Joaquín Marhuenda Fructuoso y Sonia Sanabria García 222/2005 Human capital accumulation and geography: empirical evidence in the European Union
Jesús López-Rodríguez, J. Andrés Faíña y Jose Lopez Rodríguez
223/2005 Auditors' Forecasting in Going Concern Decisions: Framing, Confidence and Information Proc- essing
Waymond Rodgers and Andrés Guiral
224/2005 The effect of Structural Fund spending on the Galician region: an assessment of the 1994-1999 and 2000-2006 Galician CSFs
José Ramón Cancelo de la Torre, J. Andrés Faíña and Jesús López-Rodríguez
225/2005 The effects of ownership structure and board composition on the audit committee activity: Span- ish evidence
Carlos Fernández Méndez and Rubén Arrondo García
226/2005 Cross-country determinants of bank income smoothing by managing loan loss provisions Ana Rosa Fonseca and Francisco González
227/2005 Incumplimiento fiscal en el irpf (1993-2000): un análisis de sus factores determinantes Alejandro Estellér Moré
228/2005 Region versus Industry effects: volatility transmission Pilar Soriano Felipe and Francisco J. Climent Diranzo
229/2005 Concurrent Engineering: The Moderating Effect Of Uncertainty On New Product Development Success
Daniel Vázquez-Bustelo and Sandra Valle
230/2005 On zero lower bound traps: a framework for the analysis of monetary policy in the ‘age’ of cen- tral banks
Alfonso Palacio-Vera
231/2005 Reconciling Sustainability and Discounting in Cost Benefit Analysis: a methodological proposal M. Carmen Almansa Sáez and Javier Calatrava Requena
232/2005 Can The Excess Of Liquidity Affect The Effectiveness Of The European Monetary Policy?
Santiago Carbó Valverde and Rafael López del Paso
233/2005 Inheritance Taxes In The Eu Fiscal Systems: The Present Situation And Future Perspectives.
Miguel Angel Barberán Lahuerta
234/2006 Bank Ownership And Informativeness Of Earnings.
Víctor M. González
235/2006 Developing A Predictive Method: A Comparative Study Of The Partial Least Squares Vs Maxi- mum Likelihood Techniques.
Waymond Rodgers, Paul Pavlou and Andres Guiral.
236/2006 Using Compromise Programming for Macroeconomic Policy Making in a General Equilibrium Framework: Theory and Application to the Spanish Economy.
Francisco J. André, M. Alejandro Cardenete y Carlos Romero.
237/2006 Bank Market Power And Sme Financing Constraints.
Santiago Carbó-Valverde, Francisco Rodríguez-Fernández y Gregory F. Udell.
238/2006 Trade Effects Of Monetary Agreements: Evidence For Oecd Countries.
Salvador Gil-Pareja, Rafael Llorca-Vivero y José Antonio Martínez-Serrano.
239/2006 The Quality Of Institutions: A Genetic Programming Approach.
Marcos Álvarez-Díaz y Gonzalo Caballero Miguez.
240/2006 La interacción entre el éxito competitivo y las condiciones del mercado doméstico como deter- minantes de la decisión de exportación en las Pymes.
Francisco García Pérez.
241/2006 Una estimación de la depreciación del capital humano por sectores, por ocupación y en el tiempo.
Inés P. Murillo.
242/2006 Consumption And Leisure Externalities, Economic Growth And Equilibrium Efficiency.
Manuel A. Gómez.
243/2006 Measuring efficiency in education: an analysis of different approaches for incorporating non-discretionary inputs.
Jose Manuel Cordero-Ferrera, Francisco Pedraja-Chaparro y Javier Salinas-Jiménez
244/2006 Did The European Exchange-Rate Mechanism Contribute To The Integration Of Peripheral Countries?.
Salvador Gil-Pareja, Rafael Llorca-Vivero y José Antonio Martínez-Serrano 245/2006 Intergenerational Health Mobility: An Empirical Approach Based On The Echp.
Marta Pascual and David Cantarero
246/2006 Measurement and analysis of the Spanish Stock Exchange using the Lyapunov exponent with digital technology.
Salvador Rojí Ferrari and Ana Gonzalez Marcos
247/2006 Testing For Structural Breaks In Variance Withadditive Outliers And Measurement Errors.
Paulo M.M. Rodrigues and Antonio Rubia
248/2006 The Cost Of Market Power In Banking: Social Welfare Loss Vs. Cost Inefficiency.
Joaquín Maudos and Juan Fernández de Guevara
249/2006 Elasticidades de largo plazo de la demanda de vivienda: evidencia para España (1885-2000).
Desiderio Romero Jordán, José Félix Sanz Sanz y César Pérez López 250/2006 Regional Income Disparities in Europe: What role for location?.
Jesús López-Rodríguez and J. Andrés Faíña
251/2006 Funciones abreviadas de bienestar social: Una forma sencilla de simultanear la medición de la eficiencia y la equidad de las políticas de gasto público.
Nuria Badenes Plá y Daniel Santín González
252/2006 “The momentum effect in the Spanish stock market: Omitted risk factors or investor behaviour?”.
Luis Muga and Rafael Santamaría
253/2006 Dinámica de precios en el mercado español de gasolina: un equilibrio de colusión tácita.
Jordi Perdiguero García
254/2006 Desigualdad regional en España: renta permanente versus renta corriente.
José M.Pastor, Empar Pons y Lorenzo Serrano
255/2006 Environmental implications of organic food preferences: an application of the impure public goods model.
Ana Maria Aldanondo-Ochoa y Carmen Almansa-Sáez
256/2006 Family tax credits versus family allowances when labour supply matters: Evidence for Spain.
José Felix Sanz-Sanz, Desiderio Romero-Jordán y Santiago Álvarez-García
257/2006 La internacionalización de la empresa manufacturera española: efectos del capital humano genérico y específico.
José López Rodríguez
258/2006 Evaluación de las migraciones interregionales en España, 1996-2004.
María Martínez Torres
259/2006 Efficiency and market power in Spanish banking.
Rolf Färe, Shawna Grosskopf y Emili Tortosa-Ausina.
260/2006 Asimetrías en volatilidad, beta y contagios entre las empresas grandes y pequeñas cotizadas en la bolsa española.
Helena Chuliá y Hipòlit Torró.
261/2006 Birth Replacement Ratios: New Measures of Period Population Replacement.
José Antonio Ortega.
262/2006 Accidentes de tráfico, víctimas mortales y consumo de alcohol.
José Mª Arranz y Ana I. Gil.
263/2006 Análisis de la Presencia de la Mujer en los Consejos de Administración de las Mil Mayores Em- presas Españolas.
Ruth Mateos de Cabo, Lorenzo Escot Mangas y Ricardo Gimeno Nogués.
264/2006 Crisis y Reforma del Pacto de Estabilidad y Crecimiento. Las Limitaciones de la Política Econó- mica en Europa.
Ignacio Álvarez Peralta.
265/2006 Have Child Tax Allowances Affected Family Size? A Microdata Study For Spain (1996-2000).
Jaime Vallés-Giménez y Anabel Zárate-Marco.
266/2006 Health Human Capital And The Shift From Foraging To Farming.
Paolo Rungo.
267/2006 Financiación Autonómica y Política de la Competencia: El Mercado de Gasolina en Canarias.
Juan Luis Jiménez y Jordi Perdiguero.
268/2006 El cumplimiento del Protocolo de Kyoto para los hogares españoles: el papel de la imposición sobre la energía.
Desiderio Romero-Jordán y José Félix Sanz-Sanz.
269/2006 Banking competition, financial dependence and economic growth Joaquín Maudos y Juan Fernández de Guevara
270/2006 Efficiency, subsidies and environmental adaptation of animal farming under CAP Werner Kleinhanß, Carmen Murillo, Carlos San Juan y Stefan Sperlich
271/2006 Interest Groups, Incentives to Cooperation and Decision-Making Process in the Eu