577
Hemoglobin role in NAFLD. , 2018; 17 (4): 577-584
Association Between Serum
Hemoglobin Levels and Non Alcoholic Fatty
Liver Disease in a Mexican Population
Eva Juárez-Hernández,* Norberto C. Chávez-Tapia,*,** Diana C. Brizuela-Alcántara,** Misael Uribe,** Martha H. Ramos-Ostos,*** Natalia Nuño-Lámbarri* * Translational Research Unit, Medica Sur Clinic & Foundation. Mexico City, Mexico. ** Obesity and Digestive Diseases Unit, Medica Sur Clinic & Foundation. Mexico City, Mexico. *** CIDyT, Medica Sur Clinic & Foundation. Mexico City, Mexico.
July-August, Vol. 17 No. 4, 2018: 577-584
ORIGINAL ARTICLE
INTRODUCTION
Nonalcoholic fatty liver disease (NAFLD) is a chronic liver disease and its development is a complex multifacto-rial process that involves multiple genetic and protein reg-ulation alterations that are associated globally with overweight and obesity, becoming one of the most
com-mon hepatic diseases in adults and children.1,2 The
spec-trum of this illness ranges from steatosis to nonalcoholic steatohepatitis (NASH), evolving through cirrhosis and
liver failure.3-5 The second cause of hepatic transplantation
in the United States is related to the evolution of NASH to cirrhosis and is also increasing in Europe. Several sero-transferases, such as aspartate aminotransferase (AST),
alanine aminotransferase (ALT) and γ-glutamyltransferase
(GGT) are strongly associated with steatosis and may act as serum biomarkers of liver damage.
The usefulness of various diagnostic-imaging tools has been assessed to identify liver fat levels. Hepatic ultra-sound (USG) is the most simple and economical method to identify steatosis. In the general population the sensitiv-ity and specificsensitiv-ity of USG to detect steatohepatitis is 60-94% and 84-95% respectively, however it is not useful for fibrosis detection which is the main prognostic factor for NAFLD progression.
Transient elastography has demonstrated its utility de-tecting liver fibrosis, especially in advanced stages. To im-prove the elastography performance is recommended the combination with other non-invasive markers. However, the clinical practice guidelines suggest a moderate level of The Official Journal of the Mexican Association of Hepatology,
the Latin-American Association for Study of the Liver and the Canadian Association for the Study of the Liver
Manuscript received: Manuscript received:Manuscript received:
Manuscript received:Manuscript received: June 28, 2018. Manuscript accepted:Manuscript accepted:Manuscript accepted:Manuscript accepted:Manuscript accepted: September 11, 2017.
DOI: 10.5604/01.3001.0012.0920 A B S T R A C T A B S T R A C T A B S T R A C T A B S T R A C T A B S T R A C T
Introduction and aim. Introduction and aim.Introduction and aim. Introduction and aim.
Introduction and aim. Nonalcoholic fatty liver disease (NAFLD) is closely associated with overweight and obesity, becoming one of the most prevalent hepatic diseases nowadays. Circulating hemoglobin (Hb) concentration is significantly higher in people with NAFLD, compared to healthy patients. While liver biopsy remains the gold standard for NAFLD diagnosis, it is not the best tech-nique due to adverse events that may occur. Therefore it is important to find less invasive and more sensitive markers. This study aimed to determine the association of serum Hb levels in patients with steatosis and fibrosis as a noninvasive marker. MaterialMaterialMaterialMaterialMaterial and methods.
and methods.and methods. and methods.
and methods. A 1,186 patient cross-sectional study nested in a randomized clinical trial (NCT01874249) was conducted. Patients were diagnosed by ultrasound for hepatic steatosis and fibroscan for fibrosis; blood test and anthropometric measurements were also assessed. Results.Results.Results.Results.Results. Serum Hb increased proportionally related to the steatosis level, being significantly higher in patients with se-vere steatosis than in patients with moderate and mild steatosis. Conclusion.Conclusion.Conclusion.Conclusion.Conclusion. Patients with non-alcoholic fatty liver disease showed elevated levels of circulating Hb, evidence that suggests that Hb exerts a protective role, as it may act as an antioxidant and may counteract the adverse effects of this disease.
Key words. Key words.Key words. Key words.
evidence in conjunction with other non-invasive liver
fi-brosis markers.10
Moreover elevated levels of free serum hemoglobin (Hb) have been associated with increased steatosis preva-lence, this relation was independent of body mass index (BMI), type 2 diabetes, and other metabolic diseases, sug-gesting that Hb could be a biomarker for the disease. Also, the knowledge that erythrocytes specifically expressed Hb has been questioned since it has been found in different cell types including neurons, retinal cells, alveolar cells, kidney mesangial cells, macrophages, and hepatocytes, fa-cilitating reactive oxygen and nitrogen species detoxifica-tion.4,5,11-13
EXPERIMENTAL PROCEDURES
Study design
A cross-sectional study nested in a randomized clinical trial (NCT01874249) (https://clinicaltrials.gov/show/ NCT01874249) was performed in Medica Sur Clinic and Foundation Preventive Medicine Unit. The ethics com-mittee approved the protocol and all participants received an informed consent.
The sample was selected from a consecutive number of patients who attended a preventive medical examination between June 2013 and June 2015. Participating subjects were between 18 and 69 years old, had overweight or
obes-ity (BMI ≥ 27 kg/m2), and hepatic steatosis, diagnosed by
ultrasound. Patients were randomized into five groups of intervention according to random control trial’s (RCT) methodology, which is electronic educational information about causes and consequences of NAFLD. Only two of these groups were evaluated by transient elastography to assess the presence of liver fibrosis. Exclusion criteria: liver disease other than NAFLD; tamoxifen, methotrexate, amiodarone, diltiazem or any antiretroviral; alcohol > 140 g per week, viral or autoimmune liver diseases and blood transfusion before 1990. To compare serum Hb levels, a control group of 289 patients apparently healthy, without
liver steatosis and body mass index < 25 kg/m2 was
in-cluded. The control group was extracted from another
cross-sectional study. Patients with BMI < 25 kg/m2 were
selected to compare serum hemoglobin levels with the study group.
Abdominal ultrasound was performed with a six-hour fasting; a 3.5 MHz transducer (Elegra; Siemens Medical Systems, Mountain Grove CA) was used to obtain a sagit-tal view of the right lobe of the liver, a transverse view of the lateral segment of the liver and any focal areas of al-tered echotexture. Liver steatosis was defined as increased parenchymal echogenicity regarding kidney cortex, with-out portal and hepatic vein echogenicity and poor
visuali-zation of the diaphragm and the liver. The degree of liver steatosis was classified according to ultrasound imaging characteristics, mild steatosis with increased hepatic echo-genicity, visible periportal and diaphragmatic echogenici-ty; moderate steatosis, with increased hepatic echogenicity and imperceptible periportal echogenicity, without dia-phragm shadowing; and severe steatosis with increased he-patic echogenicity with subtle periportal echogenicity and
shadowing of the diaphragm.14 Body fat percentage was
as-sessed by bioelectrical impedance (Tanita Corporation, Tokyo, Japan).
Transient elastography was performed with both probes (M and XL) in all patients, considered accurate if they fulfilled the following characteristics:
• At least ten valid shots.
• ≥ 60% success rate and
• Interquartile/median range (IQR/M) ≤ 30%.
To decide the probe size, a cut probe of ≥ 35 mm thick
in the abdominal ultrasound (distance from the skin to the liver) was used. The fibrosis degree was determined
ac-cording to the Wong, et al. cutoffs; F2 > 7 kPa, F3 > 8.7
kPa and F4 >10.3 kPa.15
Complete blood count, blood glucose, lipid panel (to-tal cholesterol, HDL, triglycerides and LDL), C-reactive protein, total bilirubin (TB), direct bilirubin (DB), indi-rect bilirubin (IB), blood urea nitrogen,, creatinine, Hb, liver function test and anthropometric measurements (weight, height, waist and hip circumference, waist-hip index ratio, BMI and body composition by bioelectrical impedance) were evaluated in fasting. Demographic and clinical characteristics were evaluated in all patients.
Statistical analysis
Variables distribution was determined using the Kol-mogorov-Smirnov test. Continuous variables are present-ed as mpresent-edians and interquartile range; categorical variables are presented as numbers and percentages. The difference of serum Hb concentrations in steatosis was performed by a Kruskal-Wallis test with adjustments for body mass in-dex and smoking. To compare the differences between se-rum Hb levels and clinical characteristics at each steatosis level and liver fibrosis, patients were classified into two groups according to the mean Hb concentration in the population. This association was analyzed by
Mann-Whit-ney U. the p-value ≤ 0.05 was considered statistically
579
Hemoglobin role in NAFLD. , 2018; 17 (4): 577-584
RESULTS
The clinical trial included 1186 patients, of whom 206 were excluded for not having the diagnosis of hepatic stea-tosis; therefore only 997 patients were included (Figure 1). Most of the population on study group were men (82.4%) with an average age of 47 ± 8 years and a mean BMI of 29.8
kg/m2 [28.4-32.3], 26.8% of the population had a smoking
history. The general characteristics of the control group and patients with steatosis are shown in table 1.
According to abdominal ultrasound, most patients 41.4% (n = 413) had a slight degree of hepatic steatosis, 38.6% (n = 385) moderate steatosis and 7% (n = 73) severe steatosis. As part of the study, transient elastography was performed in 40.9% (n = 367) patients, the mean success rate for transient elastography evaluation was a 100% [IQR 88-100]. Fibrosis prevalence was 12% (n = 120), of which 3.6% (n = 36) had advanced fibrosis (F3-F4) according to the Metavir fibrosis scale. Since only 40% of patients had transient elastography, we evaluated liver fibrosis accord-ing to NAFLD Score and FIB4 in a study group. Serum hemoglobin was not associated with presence or severity of liver fibrosis.
The median serum Hb concentration in study group was 14.9 mg/dL [IQR 14.2-15.9] for the control group; for the mild steatosis group 15.7 mg/dL [IQR 14.8-16.4]; for the moderate steatosis group 16.1 mg/dL [IQR 15.4-16.8] and for the severe steatosis group 16.3 mg/dL [IQR 15.8-16.8]. In the comparison analysis, serum Hb concentration
increased proportional to the steatosis level (p ≤ 0.001),
being significantly higher in patients with severe steatosis than in patients with moderate and mild steatosis (Figure 2).
Patients with steatosis were divided into two groups re-garding the Hb concentration median (15.9 mg/dL), the proportion of patients with moderate and severe steatosis that show higher levels above the median were 58.5%
(n = 233) and 75.7% (n = 56) respectively (p ≤ 0.001).
When comparing Hb levels in the presence of fibrosis, no significant associations were found. However, these pa-tients showed significantly lower serum HDL levels and higher weight, BMI, waist circumference, body fat mass, as well as higher PCR and AST serum levels.
Figure 1. Figure 1. Figure 1. Figure 1.
Figure 1. Patient’s distribution according steatosis stage and serum Hb levels. RCT: randomized clinical trial. Hb: hemoglobin.
Control group (n = 289)
Exclusion 17.1% (206) Non steatosis
Patients included in RCT 1,186
Transient elastography 36.8% (367)
F0 → 68.3% (251) F1 – F2 → 28.6% (105)
F3 – F4 → 4% (15)
Mild steatosis 41.4% (413)
Hb < 15.9 mg/dL 45.5% (188)
Moderate steatosis 38.6% (385)
Hb < 15.9 mg/dL 60% (231)
Severe steatosis 7.3% (73)
Hb < 15.9 mg/dL 75.3% (55)
Figure 2. Figure 2.Figure 2. Figure 2.
Figure 2. Serum Hb differences between control group and patients with liver steatosis.
Hemoglobin
(mg/dL)
20
15
10
5
0
Control Mild Moderate Severe
group steatosis steatosis steatosis
Steatosis stage
* p ≤ 0.001 ** p ≤ 0.05
Juárez-Hernández E, et al.
, 2018; 17 (4): 577-584
Characteristic Study group (n=997) Control group (n=289) p
% (n) /Median [IQR] % (n) /Median [IQR]
Non steatosis Mild steatosis Moderate steatosis Severe steatosis
(n = 126) (n = 413) (n = 385) (n = 73)
Male 66.7% (84) 77.2% (319) 89.6% (345) 94.5% (69) 47.1% (136) ≤ 0.0001
Age (years) 44 (40-52) 47 (41-53) 46 (40-53) 47 (41-53) 40 (36-45) ≤ 0.0001
Weight (kg) 84.4 (76.6-92) 86 (78.8-93.6) 90.4 (83.1-100.9) 95.2 (88.2-106.2) 62.7 (56.5-70.6) ≤ 0.0001 Height (m) 1.70 (1.60-1.76) 1.70 (1.63-1.76) 1.72 (1.67-1.77) 1.72 (1.69-1.77) 1.67 (1.60-1.73) ≤ 0.0001
BMI (kg/m2) 28.8 (27.9-30.6) 29.4 (28.2-31.5) 30.4 (28.6-33.4) 31.6 (29.8-35.3) 22.9 (21.7-24) ≤ 0.0001
WC (cm) 100 (95-104) 102 (97-107) 105 (100-112) 110 (102.7-117) 81.5 (78-86) ≤ 0.0001
Body fat mass (%) 31.6 (27-37.7) 31.3 (27.9-36.7) 31.6 (28.6-35.6) 33.5 (30.5 -39.6) 23.1 (20.5-29.2) ≤ 0.0001
Diabetes mellitus 4.0% (5) 5.1% (21) 7.8% (30) 12.3% (9) NA
Hypertension 9.5% (12) 17.7% (73) 19.2% (74) 16.4% (12) NA
Metabolic syndrome 24.6% (31) 40% (165) 50.1% (193) 45.2% (33) NA
Smoking 34.1% (43) 24.7% (102) 26.8% (103) 26% (19) 8.3% (24) ≤ 0.0001
Glucose (mg/dL) 93.4 (89-98) 95.2 (90-102.6) 98.2 (92-108) 103.6 (93.2-119.2) 88.3 (84-93) ≤ 0.0001
Creatinine (mg(dL) 0.90 (0.75-1.01) 0.92 (0.81-1.02) 0.93 (0.85-1.02) 0.96 (0.88-1.06) 0.84 (0.7-0.9) ≤ 0.0001
Uric acid (mg/dL) 6.0 (5.1-7.1) 6.2 (5.4-7.2) 6.6 (5.9-7.5) 7.03 (6.2-7.9) NA
CRP (mg/L) 2.3 (0.99-3.8) 2.2 (1.1-3.8) 2.4 (1.3-4.7) 3 (1.7-5) 0.9 (0.4-1.5) ≤ 0.0001
Albumin (mg/dL) 4.1 (3.9-4.2) 4.1 (4.-4.3) 4.2 (4.0-4.4) 4.2 (4.0-4.4) 4.2 (4.1-4.4) 0.02
Alkaline phosphatase (U/L) 68 (56-77) 67 (59-80) 70 (60-83) 69 (61-85.5) 58.6 (50.5-68) ≤ 0.0001
Total bilirubin (mg/dL) 0.74 (0.63-0.95) 0.81 (0.66-1.01) 0.84 (0.68-1.05) 0.81 (0.70-1.07) 0.87 (0.7-1.06) ≤ 0.0001 Direct bilirubin (mg/dL) 0.11 (0.0-0.14) 0.11 (0.0-0.14) 0.12 (0.0-0.15) 0.12 (0.0-0.15) 0.11 (0.10-0.13) ≤ 0.0001
AST (U/L) 24.5 (21.7-30) 26 (23-33) 30 (25-37) 33 (26.5-42) 22.2 (19-25) ≤ 0.0001
ALT (U/L) 25 (19-36) 30 (23-41) 39 (30-54) 46 (35-62.5) 20.6 (15.5-27) ≤ 0.0001
Hb (g(dL) 15.4 (14.4-16.1) 15.7 (14.8 -16.4) 16.1 (15.4-16.8) 16.3 (15.8 -16.8) 14.9 (14.2-15.9) ≤ 0.0001 Platelets (x 103/μL) 221 (192-252) 224 (193.5-260.5) 213 (182.5-245.5) 219 (192-251.5) 219.2 (200-260) 0.118
Triglycerides (mg/dL) 151.5 (110-207.2) 172.7 (128.5-237) 197 (149.1-280.9) 212 (149.6-268.8) 112.3 (85-149.5) ≤ 0.0001 Cholesterol (mg/dL) 204.5 (174.7-230.2) 204 (179-232) 205 (178.5-229.1) 211 (172.6-232.7) 190.9 (175-214.5) 0.001
HDL (mg/dL) 45 (38-53) 42 (36-47) 39 (35-44.1) 39 (36-44.1) 48.7 (42-56) ≤ 0.0001
LDL (mg/dL) 124 (98.7-145) 124 (101-147) 120.2 (99-143) 123 (93-148.5) 116.2 (103-135.5) 0.06
581
Hemoglobin role in NAFLD. , 2018; 17 (4): 577-584
It was observed that patients with mild and moderate steatosis with high Hb levels increased their creatinine, total and direct bilirubin concentrations; nevertheless, there was a decrease in the fat percentage, platelets and
HDL, (P ≤ 0.05). However patients with elevated Hb
lev-els in the three different steatosis degrees, compared to those with low Hb levels, shown a significant increase in
albumin, AST and ALT levels (P ≤ 0.05). The uric acid
concentration was found to be increased in patients with mild and severe steatosis, coupled with increased Hb
levels (P ≤ 0.05) (Table 2).
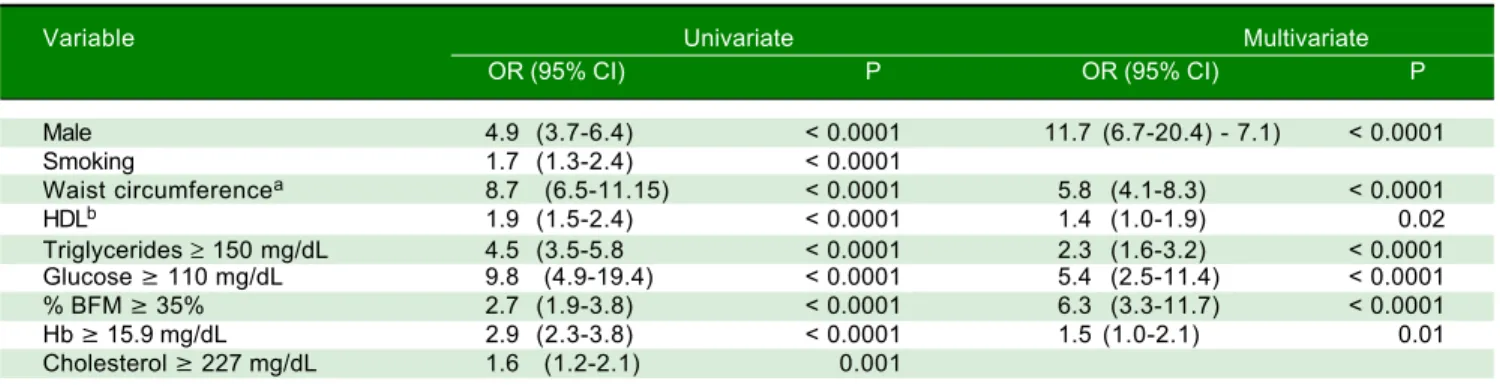
In multivariate analysis, gender, waist circumference, serum lipids and hemoglobin were an independent factor for the presence of NAFLD. (Table 3) Independent rela-tionship of serum hemoglobin was also for steatosis severity (Table 4).
DISCUSSION
Hb is the most common component in erythrocytes and acts as a carbon dioxide and oxygen carrier through the
vascular network to body cells,4,13 which is relatively a
recent adaptation during evolution. Also, Hb performs other cellular activities, including oxygen sensing, intrac-ellular oxygen transport, iron metabolism regulation,
ni-tric oxide (NO) and hydrogen peroxide scavenging.16
Patients with NAFLD have been found to have signifi-cantly higher serum Hb concentrations than the healthy
con-trols,17-21 indeed they are at an increased risk of generating
abnormal liver function, as well is also the primary
inde-pendent predictor of histologic severity in liver biopsy.17,22
In this study, the serum Hb concentration increased proportionally about the steatosis level, being significantly higher in patients with severe steatosis than in patients with moderate and mild steatosis (Figure 2). However, when comparing Hb concentrations in the presence of fi-brosis, no significant associations were found. Patients with high Hb levels showed alterations in other metabolic syndrome indicators, such as lipid profile, liver function tests, as well as indicators of renal function and albumin.
We have observed the association between Hb levels and the degree of hepatic steatosis in a group of patients with homogeneous clinical and demographic characteris-tics; confounding variables involved in elevation of Hb levels, such as smoking and BMI were adjusted in the sta-tistical analysis, however since it is a nested study, Hb as-sociation with liver fibrosis was not significant because
the insufficient sample size. Moreover, Xu, et al.
men-tioned that NAFLD patients had higher serum Hb con-centrations than the healthy controls, suggesting a protective role for Hb in the presence of steatosis, but when inflammation and necrosis appear in the liver, the protective effect disappears.
Table 2.
Patient’s baseline characteristics by group.
Characteristic Mild steatosis Moderate steatosis S e vere steatosis Hb ≥ 15.9 mg/dL
Hb < 15.9 mg/dL
P
Hb
≥
15.7
mg/dL
Hb < 15.9 mg/dL
P
Hb
≥
15.9
mg/dL
Hb < 15.9 mg/dL
p Age (years) 4 7 (42-54) 4 6 (40-53) N S 4 9 (42-55) 4 5 (40-52) ** 5 0 (47-56) 4 4 (40-51) * Weight (kg) 82.4 (75.2-91) 88.8 (83-96.6) ** 90.1 (81.7-101.7) 90.1 (84-99) N S 90.4 (84.4-99.4) 95.4 (88.5-109.5) N S Height (m) 1.67 (1.59-1.73) 1.72 (1.67-1.77) ** 1.71 (1.64-1.77) 1.72 (1.68-1.77) N S 1.70 (1.68-1.74) 1.73 (1.69-1.78) N S WC (cm) 1 0 2 (95-105.3) 103.8 (99-107) ** 1 0 6 (100-112) 1 0 4 (100.1-112) N S 1 0 9 (101-115) 1 1 0 (103-117) N S BFM (%) 32.4 (28.6-38.1) 31.05 (27.9-32.5) ** 3 2 (29.3-38.9) 3 1 (28.1-34.6) * 3 2 (28.7-39.6) 34.6 (30.9-39.5) N S Creatinine (mg/dL) 0.8 (0.7-0.9) 0 .9 (0.8-1.06) ** 0 .9 (0.8-1.0) 0 .9 (0.8-1.02) * 0 .9 (0.7-1.02) 0.97 (0.9-1.08) N S
Uric Acid (mg/dL)
5 .9 (5.1-6.9) 6 .5 (5.8-7.3) ** 6 .6 (5.7-7.7) 6 .6 (5.9-7.5) N S 6 .5 (5.3-6.8) 7 .2 (6.6-8.1) * CRP (mg/L) 2 .4 (1.2-4.5) 2 .0 (0.9-3.7) * 2 .6 (1.3-5.0) 2 .2 (1.2-3.9) N S 3 .4 (2.2-4.8) 3 .2 (1.6-5.2) N S Albumin (mg/dL) 4.1 (3.9-4.2) 4 .2 (4.0-4.4) ** 4 .1 (4.0-4.3) 4 .2 (4.1-4.4) ** 4 .0 (3.8-4.2) 4 .2 (4.0-4.4) * TB 0.76 (0.63-0.92) 0.92 (0.74-1.11) ** 0 .8 (0.6-0.9) 0 .8 (0.7-1.1) ** 0.61 (0.69-0.9) 0 .8 (0.7-1.0) N S D B 0.10 (0.0-0.13) 0.13 (0.0-0.16) ** 0.10 (0.0-0.13) 0.13 (0.0-1.17) ** 0.12 (0.0-0.16) 0.12 (0.02-0.15) N S AST (U/L) 26 (22-30) 2 8 (23-36) ** 2 7 (24-33) 3 1 (26-38) ** 2 7 (24.7-38.7) 3 5 (29.2-43.7) * ALT (U/L) 28 (21-40) 3 5 (26-48) ** 3 5 (24-33) 4 2 (32-59) ** 32.5 (25.7-43.7) 5 1 (38.2-64.5) * Platelets (x10
3 /
μ L ) 2 3 4 (199-269) 212.5 (186-247.7) ** 2 2 4 (188.5-260) 2 0 7 (181-231) * 207.5 (184.5-272) 221.5 (193.7-249.5) N S Triglycerides (mg/dL) 162.2 (121-225) 1 8 8 (138-254) * 1 9 9 (142-287) 1 9 8 (152-272) N S 190.2 (153-294) 2 1 7 (148-270) N S HDL (mg/dL) 4 4 (37.5-50.3) 4 0 (36-45) ** 4 1 (35-47.05) 38.5 (34.9-43) * 3 9 (34.8-48.2) 3 9 (36-43) N S LDL (mg/dL) 124 (100-147) 129.5 (103-152) * 124.6 (100-143.5) 1 2 0 (98-144) N S 9 6 (82-134) 1 2 8 (97.7-150.7) N S
Data shows a<s median [IQR]. *p
≤
0.05; **p
≤
0.001. NS: non-significant. WC: waist circumference. BFM: body fat mass. CRP: C reactive protein. TB: total bilirubin. DB: dir
ect bilirubin. AST:
Table 3. Univariate and multivariate analysis of presence of liver steatosis in control and study group.
Variable Univariate Multivariate
OR (95% CI) P OR (95% CI) P
Male 4.9 (3.7-6.4) < 0.0001 11.7 (6.7-20.4) - 7.1) < 0.0001
Smoking 1.7 (1.3-2.4) < 0.0001
Waist circumferencea 8.7 (6.5-11.15) < 0.0001 5.8 (4.1-8.3) < 0.0001
HDLb 1.9 (1.5-2.4) < 0.0001 1.4 (1.0-1.9) 0.02
Triglycerides ≥ 150 mg/dL 4.5 (3.5-5.8 < 0.0001 2.3 (1.6-3.2) < 0.0001
Glucose ≥ 110 mg/dL 9.8 (4.9-19.4) < 0.0001 5.4 (2.5-11.4) < 0.0001
% BFM ≥ 35% 2.7 (1.9-3.8) < 0.0001 6.3 (3.3-11.7) < 0.0001
Hb ≥ 15.9 mg/dL 2.9 (2.3-3.8) < 0.0001 1.5 (1.0-2.1) 0.01
Cholesterol ≥ 227 mg/dL 1.6 (1.2-2.1) 0.001
a > 88 cm in women, > 102 cm in men; b < 50 mg/dL in women, < 40 mg/dL in men. HDL: high density lipoprotein. BFM: body fat mass.
Table 4. Univariate and multivariate analysis of severe steatosis in study group.
Variable Univariate Multivariate
OR (95% CI) P OR (95% CI) P
Male 3.4 (2.3-5.0) < 0.0001 3.3 (2.1-5.2) < 0.0001
Smoking 1.0 (0.8-1.1) 0.943
Waist circumferencea 1.6 (1.2-2.1) < 0.0001 1.9 (1.4-2.5) < 0.0001
HDLb 1.5 (1.1-1.9) 0.001 1.4 (1.0-1.9) 0.009
Triglycerides ≥ 150 mg/dL 1.9 (1.5-2.6) < 0.0001 1.4 (1.0-1.9) 0.025
Glucose ≥ 110 mg/dL 2.8 (2.0-4.0) < 0.0001 2.7 (1.8-3.9) < 0.0001
% BFM ≥ 35% 1.0 (0.9-1.2) 0.322
Hb ≥ 15.9 mg/dL 2.2 (1.7-2.8) < 0.0001 1.6 (1.2-2.2) 0.001
Cholesterol ≥ 227 mg/dL 1.0 (0.9-1.2) 0.573
a > 88 cm in women, > 102 cm in men. b < 50 mg/dL in women, < 40 mg/dL in men. HDL: high density lipoprotein. BFM: body fat mass.
As well, it was observed that patients with mild and moderate steatosis who have high Hb levels increase their creatinine, which is associated with an elevated chronic kidney disease (CKD) prevalence and incidence, leading to the elevation of proinflammatory molecules and
oxida-tive stress, promoting kidney injury.23-25 The damage can
be minimized by the uric acid rise (UA) due to the in-crease in Hb since it is one of the most important antioxi-dants in the human body. Nevertheless, there is evidence that UA elevation may cause insulin resistance, which is closely related to the metabolic syndrome and NAFLD
development.26
Moreover, elevated total and direct bilirubin concen-trations regard to controls may contribute to decreasing the risk of NAFLD, probably based on its potential to an-tagonize oxidative stress and its anti-inflammatory effects that play vital roles in reducing pro-inflammatory cy-tokines production, such as 6 and interleukin-1. These findings support that bilirubin protects against NAFLD through impaired glucose metabolism, insulin resistance inhibition, inflammation suppression or com-plement activation, and lipid accumulation. Additionally, there has been growing evidence suggesting that bilirubin
may have a differential influence on lipogenesis and
lipol-ysis of adipose tissue and the free fatty acid metabolism.27
Hb uptake in mononuclear cells through CD163 re-duces circulating levels. Thus intracellular upregulation implies a protective response under adverse conditions in critical illness. Hb has been localized in kidney mesangial cells, mesencephalic dopaminergic neurons, glial cells,
and also in hepatocytes,16 which confer resistance to
oxida-tive stress by detoxification of highly oxidizing radicals and oxygen homeostasis modulation, suggesting that Hb functions as an antioxidant. Another possible explanation for Hb elevation could be the mobilization of stem cells into the circulation during the NAFLD, as these cells ex-press significant levels of Hb.
Hb is the most important potential source of heme (the functional group of Hb), when oxidized it may propagate inflammatory reactions and enhance cellular susceptibility
to lipid peroxidation and oxidative stress;30 the potential
explanation for the associations observed between in-creased Hb and NAFLD may be related to the excessive iron accumulation regarding physiologic
require-ments,17,20,29 in fact, NAFLD can be strongly predicted by
com-583
Hemoglobin role in NAFLD. , 2018; 17 (4): 577-584
plicated, however, its protective effect can be attributed to an increase in a protein called hepcidin, which is respon-sible for retaining iron excess, thereby reducing oxidative
stress.31 Iron reduction by phlebotomy treatment,
im-prove NAFLD activity score, possibly due to reactive
oxy-gen species reduction.18,32
Heme has also been identified as a Toll-like receptor 4 (TLR4) ligand, which might induce or ameliorate an
in-flammatory response in some cell types.30 On the other
hand, heme transport to the liver under physiological con-ditions performed in part by HDL and since HDL levels are decreased in NAFLD when standardized by Hb, se-rum Hb might not be properly transported to the liver for further processing. Therefore, it seems important to ob-tain desirable HDL concentrations for the prevention of
fatty liver disease.33
Some limitations of our study are the lack of liver stea-tosis measurement in the control group; hepatic steastea-tosis was evaluated by ultrasound, which has precision limita-tions as a dependent operator method. The ratio of hepatic steatosis in each fraction of serum hemoglobin (REF) has been observed; however, only the association of hemo-globin with liver damage was analyzed with the total con-centration of serum hemoglobin.
CONCLUSION
In this study, NAFLD patients showed high circulating Hb levels, related to hepatic steatosis degree, which could be proposed as an antioxidant since may counteract the ad-verse effects of this disease.
It is important to mention that Hb could emerge as a serum marker for an early and accurate NAFLD detec-tion.
ABBREVIATIONS
• ALT: alanine aminotransferase.
• AST: aspartate aminotransferase.
• BMI: body mass index.
• CKD: chronic kidney disease
• DB: direct bilirubin
• GGT: γ-glutamyltransferase.
• Hb: hemoglobin.
• HDL: high-density lipoprotein.
• IB: indirect bilirubin.
• IQR/M: interquartile / median range.
• LDL: low-density lipoprotein.
• NAFLD: nonalcoholic fatty liver disease.
• NASH: nonalcoholic steatohepatitis.
• NO: nitric oxide.
• RCT: random control trial’s.
• TB: total bilirubin.
• TLR4: Toll-like receptor 4.
• UA: uric acid.
• USG: Hepatic ultrasound.
FUNDING
This study was funded by Medica Sur Clinic & Foun-dation.
CONFLICT OF INTEREST
Eva Juárez-Hernández, Norberto C. Chávez-Tapia, Di-ana Brizuela-Alcántara, Misael Uribe, Martha H. Ramos-Ostos and Natalia Nuño-Lámbarri declare not to have any conflict of interest.
ETHICAL APPROVAL
All procedures performed in studies involving human participants were in accordance with the ethical standards of Medica Sur ethics research committee in accordance with the Regulation of the General Law of Health in Mex-ico and with the 1964 Helsinki declaration.
INFORMED CONSENT
Informed consent was obtained from all individual participants included in the study.
ACKNOWLEDGMENTS
Juárez-Hernández and Nuño-Lámbarri wrote the arti-cle. Uribe, Ramos-Ostos and Chávez-Tapia revised and corrected the final version of the manuscript. Brizuela-Al-cántara provided the data of control patients included in the analysis. It is it appreciated the assistance received by Beatriz Sanchez-Jimenez and Sofia Lopez-Gil in patient recruitment and to Varenka J. Barbero-Becerra in the cor-rection and improvement of this article.
REFERENCES
1. Nuño-Lámbarri N, Baulies-Domenech A, Monte MJ, G. Marin JJ, Rosales-Cruz P, Souza V, Miranda RU, et al. Liver Cho-lesterol Overload Aggravates Obstructive Cholestasis by In-ducing Oxidative Stress and Premature Death in Mice.
Oxidative Medicine and Cellular Longevity 2016; 2016.
2. Wang R, Wang X, Zhuang L. Gene expression profiling re-veals key genes and pathways related to the development
of non-alcoholic fatty liver disease. Ann Hepatol 2016; 15:
190-9.
3. Dixon JB, Bhathal PS, O'Brien PE. Nonalcoholic fatty liver dis-ease: predictors of nonalcoholic steatohepatitis and liver
fi-brosis in the severely obese. Gastroenterology 2001; 121:
91-100.
hepato-cytes and its implication in nonalcoholic steatohepatitis. PloS one 2011; 6.
5. Yu C, Xu C, Xu L, Yu J, Miao M, Li Y. Serum proteomic analy-sis revealed diagnostic value of hemoglobin for nonalcoholic
fatty liver disease. J Hepatology 2012; 56: 241-7.
6. Brodosi L, Marchignoli F, Petroni ML, Marchesini G. NASH: A
glance at the landscape of pharmacological treatment. Ann
Hepatol 2016; 15: 673-81.
7. Chang Y, Ryu S, Sung E, Jang Y. Higher concentrations of alanine aminotransferase within the reference interval
pre-dict nonalcoholic fatty liver disease. Clinical chemistry
2007; 53: 686-92.
8. Ong JP, Younossi ZM. Epidemiology and natural history of
NAFLD and NASH. Clinics in liver disease 2007; 11: 1-16.
9. Wieckowska A, Feldstein AE. Diagnosis of nonalcoholic
fat-ty liver disease: invasive versus noninvasive. Seminars in
liver disease 2008; 28: 386-95.
10. Bahl M, Qayyum A, Westphalen AC, Noworolski SM, Chu PW, Ferrell L, Tien PC, et al. Liver steatosis: investigation of opposed-phase T1-weighted liver MR signal intensity loss
and visceral fat measurement as biomarkers. Radiology
2008; 249: 160-6.
11. Ascenzi P, Bocedi A, Visca P, Altruda F, Tolosano E,
Bering-helli T, Fasano M. Hemoglobin and heme scavenging. IUBMB
life 2005; 57: 749-59.
12. Soon Yew Tang IKMC, Pei Ern Ng, Aina Hoi, Andrew M. Jen-ner. Heme Consumption Reduces Hepatic Triglyceride and Fatty Acid Accumulation in a Rat Model of NAFLD Fed
West-ernized Diet. ISRN Oxidative Medicine 2014; 2014.
13. Trak-Smayra V, Dargere D, Noun R, Albuquerque M, Yaghi C, Gannage-Yared MH, Bedossa P, et al. Serum proteomic profiling of obese patients: correlation with liver pathology
and evolution after bariatric surgery. Gut 2009; 58: 825-32.
14. Saadeh S, Younossi ZM, Remer EM, Gramlich T, Ong JP, Hurley M, Mullen KD, et al. The utility of radiological imaging
in nonalcoholic fatty liver disease. Gastroenterology 2002;
123: 745-50.
15. Wong VW, Vergniol J, Wong GL, Foucher J, Chan HL, Le Bail B, Choi PC, et al. Diagnosis of fibrosis and cirrhosis using liver stiffness measurement in nonalcoholic fatty liver
dis-ease. Hepatology 2010; 51: 454-62.
16. Li X, Wu Z, Wang Y, Mei Q, Fu X, Han W. Characterization of adult alpha- and beta-globin elevated by hydrogen peroxide in cervical cancer cells that play a cytoprotective role
against oxidative insults. PloS one 2013; 8: e54342.
17. Akyuz U, Yesil A, Yilmaz Y. Characterization of lean patients with nonalcoholic fatty liver disease: potential role of high
hemoglobin levels. Scandinavian J Gastroenterol 2015; 50:
341-6.
18. Tanoglu A, Kara M. Nonalcoholic fatty liver disease-related cardiovascular risk: Is there an association with blood
he-moglobin levels? European J Gastroenterol & Hepatol 2015;
27: 1126-9.
19. Xu L, Xu CF, Yu CH, Miao M, Li YM. Haemoglobin and non-al-coholic fatty liver disease: further evidence from a
popula-tion-based study. Gut 2009; 58: 1706-7.
20. Bai CH, Wu MS, Owaga E, Cheng SY, Pan WH, Chang JS. Relationship between hemoglobin levels and risk for
sus-pected non-alcoholic fatty liver in Taiwanese adults. Chin J
Physiol 2014; 57: 286-94.
21. Chung GE, Yim JY, Kim D, Kwak MS, Yang JI, Chung SJ, Yang SY, et al. Associations between hemoglobin concen-trations and the development of incidental metabolic
syn-drome or nonalcoholic fatty liver disease. Dig Liver Dis
2017; 49: 57-62.
22. Giorgio V, Mosca A, Alterio A, Alisi A, Grieco A, Nobili V, Miele L. Elevated Hemoglobin Level Is Associated With Ad-vanced Fibrosis in Pediatric Nonalcoholic Fatty Liver
Dis-ease. J Pediatr Gastroenterol Nutr 2017; 65: 150-5.
23. Musso G, Gambino R, Tabibian JH, Ekstedt M, Kechagias S, Hamaguchi M, Hultcrantz R, et al. Association of non-alco-holic fatty liver disease with chronic kidney disease: a
sys-tematic review and meta-analysis. PLoS medicine 2014; 11:
e1001680.
24. Orlic L, Mikolasevic I, Bagic Z, Racki S, Stimac D, Milic S. Chronic kidney disease and nonalcoholic Fatty liver
disease-is there a link? Gastroenterology Research and Practice
2014; 2014: 847539.
25. Targher G, Bertolini L, Rodella S, Lippi G, Zoppini G, Chon-chol M. Relationship between kidney function and liver
his-tology in subjects with nonalcoholic steatohepatitis. Clinical
journal of the American Society of Nephrology: CJASN
2010; 5: 2166-71.
26. Xia MF, Lin HD, Li XM, Yan HM, Bian H, Chang XX, He WY, et al. Renal function-dependent association of serum uric acid with metabolic syndrome and hepatic fat content in a
middle-aged and elderly Chinese population. Clinical and
Experi-mental Pharmacology & Physiology 2012; 39: 930-7.
27. Tian J, Zhong R, Liu C, Tang Y, Gong J, Chang J, Lou J, et al. Association between bilirubin and risk of Non-Alcoholic Fatty Liver Disease based on a prospective cohort study.
Scientific reports 2016; 6: 31006.
28. Brunyanszki A, Erdelyi K, Szczesny B, Olah G, Salomao R, Herndon DN, Szabo C. Upregulation and mitochondrial se-questration of hemoglobins occurs in circulating leukocytes during critical illness, conferring a cytoprotective phenotype.
Molecular medicine 2015.
29. Yilmaz Y. NAFLD in the absence of metabolic syndrome: dif-ferent epidemiology, pathogenetic mechanisms, risk factors
for disease progression? Seminars in liver disease 2012;
32: 14-21.
30. Widmer CC, Pereira CP, Gehrig P, Vallelian F, Schoedon G, Buehler PW, Schaer DJ. Hemoglobin can attenuate hydrogen peroxide-induced oxidative stress by acting as an
antioxida-tive peroxidase. Antioxidants & redox signaling 2010; 12:
185-98.
31. Handa P, Vemulakonda AL, Maliken BD, Morgan-Stevenson V, Nelson JE, Dhillon BK, Hennessey KA, et al. Differences in hepatic expression of iron, inflammation and
stress-relat-ed genes in patients with nonalcoholic steatohepatitis. Ann
Hepatol 2017; 16: 77-85.
32. Soon Yew Tang IKMC, Pei Ern Ng, Aina Hoi, Andrew M. Jen-ner. Heme Consumption Reduces Hepatic Triglyceride and Fatty Acid Accumulation in a Rat Model of NAFLD Fed
West-ernized Diet. ISRN Oxidative Medicine 2014; 9 (2014).
33. Trojak A, Walus-Miarka M, Wozniakiewicz E, Malecki MT, Idzior-Walus B. Nonalcoholic fatty liver disease is associated with low HDL cholesterol and coronary angioplasty in
pa-tients with type 2 diabetes. Medical Science Monitor:
Inter-national Medical Journal of Experimental and Clinical
Research 2013; 19: 1167-72.
Correspondence and reprint request: Natalia Nuño-Lámbarri, M.Sc., PhD.
Puente de Piedra, Núm. 150. Col. Toriello Guerra. Deleg. Tlalpan. C.P. 14050. Mexico City