TOWARDS A DYNAMIC ANALYSIS OF MULTIPLE-STORE SHOPPING: EVIDENCE FROM SPANISH PANEL DATA
NOEMÍ MARTÍNEZ-CARABALLO MANUEL SALVADOR
CARMEN BERNÉ PILAR GARGALLO
FUNDACIÓN DE LAS CAJAS DE AHORROS DOCUMENTO DE TRABAJO
Nº 594/2011
De conformidad con la base quinta de la convocatoria del Programa de Estímulo a la Investigación, este trabajo ha sido sometido a eva- luación externa anónima de especialistas cualificados a fin de con- trastar su nivel técnico.
ISSN: 1988-8767
La serie DOCUMENTOS DE TRABAJO incluye avances y resultados de investigaciones dentro de los pro- gramas de la Fundación de las Cajas de Ahorros.
Las opiniones son responsabilidad de los autores.
TOWARDS A DYNAMIC ANALYSIS OF MULTIPLE-STORE SHOPPING:
EVIDENCE FROM SPANISH PANEL DATA
Noemí Martínez-Caraballo*
Manuel Salvador Carmen Berné
Pilar Gargallo
ABSTRACT
This paper aims to determine why consumer purchasing of fast moving consumer goods varies over time in Spain. More specifically, we want to explain multiple-store shopping in the households belonging to an AC Nielsen panel that provides information about household shopping decisions between April 2003 and April 2004. In order to achieve this purpose, a Bayesian Dynamic Tobit model is used. The results allow us to confirm the influence of several demographical and geographical variables on household multiple-store shopping during the sample period. Managerial implications are drawn and future lines of research are suggested.
KEY WORDS
Bayesian Inference, Fast Moving Consumer Goods, MCMC, Multiple-store Shopping, Purchasing Patterns, Store Choice, Tobit Model.
JEL CODES C11, D12, M31
Corresponding author:
Noemí Martínez Caraballo, Department of Marketing Management and Market Research, Faculty of Economics and Business, University of Zaragoza, Gran Vía, 2, 50005 - Zaragoza, Spain. E-mail:
[email protected] Acknowledgements:
This research is part of the Project ECO2010-20880/ECON financed by the Research Agency of the Spanish government.
1. INTRODUCTION
The literature on consumer behavior in the retail market is skewed towards studying consumer loyalty and is based on the concept of individual reinforcement and modeling through latent profiles to establish segmentation criteria for strategic marketing planning. Most of the empirical contributions to this field of study have focused on brand choice (e.g., Jeuland, 1978;
Dube and Maute, 1996; Dekimpe et al., 1997; Andrews and Currim, 2002; Labeaga et al., 2007) and, to a lesser extent, on analyzing store choice (Wrigley et al., 1984a and 1984b; Reader, 1993), loyalty to the first-choice store (East et al., 2000) and retail format choice (González- Benito and Santos-Requejo, 2002; González-Benito, 2005). Nevertheless, over the last three decades, multiple-store shopping has attracted the attention of researchers in the marketing area, and, specifically, of those interested in studying consumer behavior.
Variety-seeking attempts to stimulate purchasing behavior by alternating between objects of choice. For example, a situation of boredom caused by a non-optimum level of stimulation from purchasing can lead to multiple-store shopping.
According to Pessemier (1985), there are two types of variety that are involved in the purchasing behavior of individuals: structural variety and temporal variety. Multiple-store shopping could be considered as observable either at a given time (static variation) or over the course of time (dynamic variation).
Both types of variety offer a wide range of research possibilities that may have implications for business management. These implications would allow firms to maintain their position in the market and verify the results of their policies and strategies for keeping customers. In this paper, we are going to focus on studying dynamic variation.
When there are alternatives available, households complement their purchases at their first-choice store with purchases at other stores (Kahn and McAlister, 1997; Rhee and Bell, 2002; Segarra, 2007). In highly competitive markets, such as the fast moving consumer goods (FMCG) markets, multiple-store shopping is ever more widespread (Kahn and McAlister, 1997;
McGoldrick and Andre, 1997; Gijsbrechts et al., 2008).
A regular store set is defined as the stores in which households regularly make purchases. These stores complement each other and may even belong to the same retail chain.
The budget of the household is allocated among the different stores in the regular store set.
Within this set, one store will typically capture the greatest proportion of expenditure, i.e., it is the first-choice store (Rhee and Bell, 2002). It is worth analyzing the composition of the household store set and its variation over time (dynamic variation in the store set).
This variation in household store set should be analyzed and taken into account by retailers. As the variation increases, the portion of the overall budget not allocated to expenditures at the first-choice store will be increasingly important.
The specific objective of this paper is to study, from a dynamic perspective, the determinants of the variation in the regular store set at which households do their FMCG shopping. For this purpose, a Bayesian statistical model is built (Rossi and Allenby, 2003; Rossi et al., 2005).
From a revision of the specialized literature, we consider different variables that may be having an effect on the dynamic variation of the regular store set. These underlying factors are:
(1) shopping pattern variables (aggregate purchase volume at the stores belonging to the store set and interpurchase time at stores); (2) demographic variables of households (social class and household size); (3) demographic characteristics of the shopper (age, employment status and whether the shopper has young children) and (4) geographical characteristics (geographical area and the size of the town or village in which the household lives).
The statistical analysis has been carried out from a dynamic viewpoint using a Tobit model. The adopted approach is Bayesian because it allows more flexibility and realism in the modeling process, making inferences that are conditional on the data and that do not depend on asymptotic results (Rossi et al., 2005). Due to the complexity of the analysis, the estimation of the parameters uses Markov Chain Monte Carlo (MCMC) methods and the data augmentation technique.
This article contributes to the marketing literature in several ways. The primary motivation for this study is to generate new insights into the nature of dynamic effects that characterize household store choice behavior. From an academic perspective, we analyze differences across households in store choice in a study of the dynamic behavior of consumers and we empirically estimate the proposed model on scanner panel data. From a managerial perspective, we provide several managerial guidelines for retailers interested in maintaining their market share, taking into account the profile of multiple-store shoppers.
The remainder of the article is organized as follows. In Section 2, a review of the relevant literature is carried out and hypotheses are formulated. Section 3 describes the database built from an AC Nielsen household panel and the statistical methodology used in the paper. Section 4 presents the empirical results and a discussion of substantive insights that can be obtained from this study and, finally, in Section 5, conclusions and managerial implications are drawn, along with suggestions for future research on this topic. In Appendix A, we introduce the full conditional distributions necessary to implement the Gibbs sampling algorithm.
2. BACKGROUND AND HYPOTHESES
The multiple-store shopping approach is considered here from a dynamic perspective.
Variation can be observed in the number of stores that belong to the store set and in the different percentage of household budget spent in each store. The greater the variation, the less loyalty there will be to any one store.
In the literature, several relationships between intrinsic and extrinsic motivations for change and multiple-store shopping have been posited (e.g., Berne et al., 2001; 2005).
However, there is little research that analyzes demographic characteristics and their effect on multiple-store shopping (Popkowski-Leszczyc and Timmermans, 1997) and, in some cases, the results are not conclusive. There are several works that have not found any relationship between demographic characteristics and consumer decisions about product categories (Chintagunta and Gupta, 1994; Fox et al., 2004).
In the light of this, we attempt to measure the dynamic variation in the store set of each household by analyzing the relationship of the degree of variation and (1) shopping pattern variables, (2) demographic variables of households, (3) demographic characteristics of the shopper, and (4) geographical characteristics.
2.1. Shopping pattern variables
The shopping patterns of the households have been analyzed in the literature by using the aggregate purchase volume and the interpurchase time.
Regarding the relationship between the purchase volume of the household and its shopping behavior, the higher the household’s total expenditure, the larger the benefits of shopping around for better prices (Mägi, 2003) and, consequently, the greater the variation in the store set. In our context, we think that a greater effort devoted to looking for better prices will lead to a store set composed of many more stores. These stores may also experience continuous exchanges of position in relative expenditure and entrances to and exits from the set, reflecting attempts to take advantage of different special offers. Thus, this larger store set may show a bigger variation over time.
However, large purchase volumes are related to household size and it is possible that larger households have less time to go shopping and, thus, tend to concentrate their shopping in just one store. In order to capture the effect of the purchase volume, discounting the effect of the household size variable, we study the impact of the per capita purchase volume on the dynamic variation in the store set and we posit that households with large per capita basket sizes will exhibit a smaller level of multiple-store shopping.
Consumers' need for variation can be affected by shopping frequency or interpurchase time. The smaller the interpurchase time, or the greater the frequency with which the consumer goes shopping, the sooner the consumer will become satisfied and the need for variety-seeking will lead to boredom or satiation (Park et al., 1991). That is to say, boredom or satiation is induced by an accumulated experience of the same brand (Givon, 1984). Although this intrinsic need for stimulus or for innovation can be encouraged by external stimuli, the choice of variety is an internal decision (Kahn, 1995). A retailer can protect the principal store by providing variety in complementary ones (Kahn, 1995).
Hence, we posit the following hypotheses about multiple-store shopping and shopping patterns can be formulated:
H1: “The higher the aggregate purchase volume per capita, the smaller the dynamic variation in the store set will be”.
H2: “The smaller the interpurchase time, the greater the dynamic variation in the store set will be”.
2.2. Demographic variables of households
In this subsection, we consider social class and household size.
Social class is determined by a complex set of variables including income, occupation and education. Household social class is an important determinant not only of how much is spent but also of how it is spent. The potential of social class as a marketing segmentation variable was first noted in the 1940s when Warner (in Coleman, 1983) found that each of the social class groups that he identified displayed unique purchase motivations and shopping behaviors (Henry, 2002). In the marketing literature and, especially in that referring to buyer behavior, social class has been considered a better variable than income as a predictor of consumer behavior (e.g., Martineau, 1958; Slocum and Mathews, 1970; Schaninger, 1981;
Shimp and Yokum, 1981; Mihić and Čulina, 2006). Households with higher income levels are usually more loyal to the first-choice store (McGoldrick and Andre, 1997; Seetharaman and Chintagunta, 1998) and, in our context, we posit that households with higher socioeconomic status may show a smaller variation over time.
Household size may have a positive effect on multiple-store shopping (Seetharaman and Chintagunta, 1998). Larger households will be more likely to have different tastes and needs (Seetharaman and Chintagunta, 1998) and, so, a higher level of multiple-store shopping will be expected. Conversely, Mägi (2003) maintains that larger households may have more time restrictions and a greater tendency to concentrate their purchases at a single store, so the
dynamic variation in the store set will be less.
Therefore, we hypothesize:
H3. “The higher the social class of the household, the smaller the dynamic variation in the store set will be”.
H4. “The bigger the household, the smaller the dynamic variation in the store set will be”.
2.3. Demographic variables of the shopper
Multiple-store shopping could also be explained by exogenous factors, out of the control of retailers, such as demographic variables (Berne et al., 2001; 2005). The variables we employ are the age of the shopper, employment status and whether the shopper has young children. We will posit several hypotheses regarding these demographic characteristics.
Several studies have demonstrated that the age of the shopper is positively related to multiple-store shopping (East et al., 1995; East et al., 2000; Mägi, 2003). One explanation for this relationship is that older consumers, especially those who are retired, have more free time and, thus, they can dedicate more time to shopping, to comparing offers and to using several stores to cover their shopping needs (East et al., 2000). Hence, a positive relationship is expected between the age of the shopper and the variation in the store set.
Time-pressured shoppers tend to strive for efficiency (Herrington and Capella, 1995).
Several studies have pointed out that households with greater work commitments and time restrictions avoid variety-seeking (East et al., 1997). People who have less free time will concentrate their purchases in a more limited number of stores in order to invest less time and effort into making purchases of frequently-used products (McGoldrick and Andre, 1997).
Furthermore, shoppers who work outside the home will be more loyal to their first-choice store (Mason, 1991; McGoldrick and Andre, 1997; Fox et al., 2004). Therefore, the dynamic variation in the store set is expected to be lower.
If the person in charge of shopping for frequently-used products is working full time (Mason, 1991), is between 25 and 40 and in a large household, they are more likely to show loyal behavior, given that their household commitments and their time restrictions are greater (East et al., 1997).
Time restrictions also emerge with the presence of children at home (Nickols and Fox, 1983; Soberon-Ferrer and Dardis, 1991). In fact, we can posit that these households will be prone to concentrate their FMCG purchases in a limited number of stores. As a result, a smaller dynamic variation in the store set could be expected.
In short, a greater volume of consumption needs, less time and more commitments can favor a lower level of multiple-store shopping. In particular, it is highly likely that households with time restrictions derived from the presence of children will concentrate their expenditure on groceries and household products at fewer stores, so their store set will probably have less variation.
Consequently, the following working hypotheses are set forth:
H5. “The older the shopper, the greater the dynamic variation in the store set will be”.
H6. “If the shopper works outside the home, then the dynamic variation in the store set will be lower”.
H7. “If the shopper has young children, then the dynamic variation in the store set will be lower”.
2.4. Geographical characteristics
Other potentially relevant influences on the dynamic variation of the store set are the geographical area and the size of the town or village in which the household lives.
Geographical areas are defined following geographical, historical or political approaches, among others. In the literature, it has been seen that geographical location exercises a significant effect on the allotment of expenditure on household services (Soberon- Ferrer and Dardis, 1991). From a commercial point of view, companies consider these geographical areas to plan their commercial routes (decisions on sales and distribution of products). This distribution of the market explains a lot of the heterogeneity that exists from the supply side (i.e., number of stores, competitive environment, etc.) and from the demand side (sociological, demographic or economic differences). So, we will include geographical area in our model in order to test the effects of this heterogeneity. We will posit that belonging to a geographical area can determine a bigger or smaller variation in the store set. Moreover, the commercial supply in the geographical areas will differ according to the size of the town or village.
Consequently, we can posit the following hypotheses:
H8: “The degree of dynamic variation in the store set will differ among geographical areas”.
H9: “The bigger the town, the greater the dynamic variation in the store set will be”.
3. EMPIRICAL ANALYSIS 3.1. The database
The database has been built from an AC Nielsen household panel data containing information about the purchases of groceries and household products carried out by 2,016 Spanish households from April 2003 to April 2004. Purchases from all outlets are captured (e.g., grocery stores, mass merchandisers, convenience stores, and so on). Tracking only grocery store purchases might obscure the phenomenon or bias the analysis.
A characterization of the AC Nielsen Homescan panel data can be seen in Table 1.
Table 1. Characterization of the AC Nielsen HomeScan Panel
Methodology
Responsible for making FMCG purchases in the household.
Proportional stratified sampling by geographic and demographic variables.
Information on everyday purchases facilitated through reading by optical readers, bar codes of FMCG.
Variables
Shopping behavior variables:
Information about the product purchased, type, number of units, value, price, brand, product variety
Store information
Frequency of purchase Personal and household variables:
Sex, age, employment status of the shopper
Household size
Presence of children at home
Household Socioeconomic Status
Habitat
Scope
National data (Iberian Peninsula and the Balearic Islands) Disaggregated data by:
AC Nielsen Areas
Formats
Store chains
To measure the variation in the store set, we have used the Consumer Behavior Herfindahl-Hirschman Index (HHI) (Theil and Finke, 1983; Meulenberg, 1989; Van Trijp and Steenkamp, 1992; Van Trijp, 1995) calculated in each period “t". This index is given by the following expression:
2m 1 k k,t t
t p
-
HHI
where: “pk,t”is the percentage of expenditure in store “k” from the initial period of the study until the current period “t” and “mt” is the total number of stores belonging to the store set of each household in period “t”.
The variation in the store set is smaller when the percentage of the budget allocated to the first-choice store is bigger; when the number of stores belonging to the store set is smaller;
and when the percentage of budget allocated to the complementary stores is smaller. In particular, if a household has only shopped in just one store until period t, then mt=1, p1,t =1 and HHIt = -1. On the other hand, the maximum level of variation would be achieved when mt , p1,t = … = m,t
p t = mt
1 and HHIt = - mt
1 0.
Each household will have a certain store set formed by one, two or more regularly used stores, one of which will be the first-choice store and the others will be complementary stores.
The regular store set consisted of a maximum of thirteen stores. In Table 2, we can see the percentage of the sample that solved their shopping needs in one store, in two stores, and so on, during the year of the study. In particular, we highlight that 6% of the sample solved their shopping needs at just one store.
Table 2. Number of stores in the household store set
# of stores # of households %
1 121 6.0
2 262 13.0
3 230 11.4
4 417 20.7
5 321 15.9
6 248 12.3
7 135 6.7
>8 135 7.3
Total 2016 100.0
In Figure 1, the histogram of HHI at the end of the one-year period analyzed is shown. It can be seen that HHI is a mixed variable with one discrete mass point and a continuous part.
The discrete part has its mass point in HHI = -1 due to the existence of a group of households that only buy in one store. On the other hand, it can be observed that the continuous part is roughly unimodal and left-skewed.
Figure 1. HHI Histogram
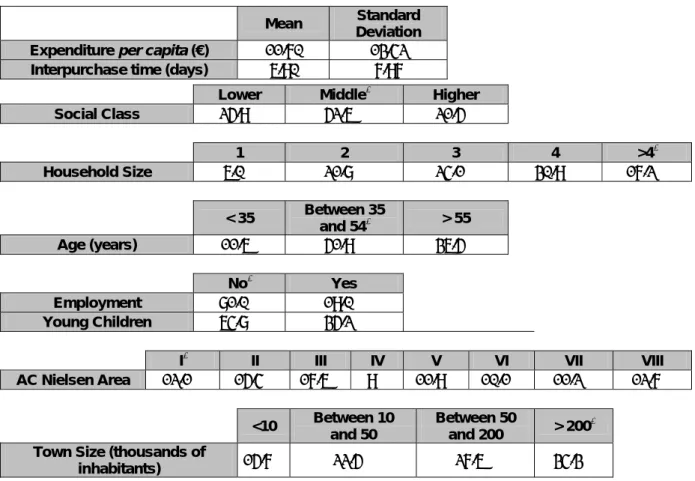
In Table 3, we can see the descriptive analysis of the independent variables considered in the study. They are social-demographic characteristics of the shoppers that have been considered in previous studies.
Table 3. Descriptive analysis of the independent variables + Mean Standard
Deviation Expenditure per capita (€) 11.70 13.42
Interpurchase time (days) 6.90 7.97
Lower Middle* Higher
Social Class 25.9% 52.6% 21.5%
1 2 3 4 >4*
Household Size 6.0% 21.8% 24.1% 30.9% 17.2%
< 35 Between 35
and 54* > 55
Age (years) 11.6% 51.9% 36.5%
No* Yes
Employment 81.0% 19.0%
Young Children 64.8% 35.2%
I* II III IV V VI VII VIII
AC Nielsen Area 12.1% 15.4% 17.6% 9% 11.9% 10.1% 11.2% 12.7%
<10 Between 10
and 50
Between 50
and 200 > 200* Town Size (thousands of
inhabitants) 15.7% 22.5% 27.6% 34.3%
+ For each categorical variable, the reference category is marked with *
In order to measure the aggregate per capita purchase volume of a household, we have considered the mean of all the shopping tickets accumulated until the considered date.
The categories of the social class variable are based on the classification used by AC Nielsen. In our database, we consider three different classes: Lower, Middle and Higher.
Work commitments are measured through two variables: the employment status and family situation of the shopper, the latter depending on whether there are any children under 12 in the household.
For the analysis of the influence of the geographical area in which the household lives, we have considered the Nielsen area. AC Nielsen divides Spain into 8 areas depending on their geographical situation (see Figure 2).
Figure 2. AC Nielsen Map of Spanish Geographical Areas
Source: Own elaboration.
3.2. Specification of the model
In this section, the statistical model used to test the hypotheses posited in Section 3 is described. A Bayesian hierarchical Tobit model is used.
An important feature of the data which influences the modeling strategy is the mixed character of the dependent variable, HHI. The most parsimonious model for dealing with its mixed character is the Tobit model. These models are often conceptualized in a hierarchical manner, where movement from one model component to the next proceeds in a logical manner.
Hierarchical Bayes methods have recently become available to marketing researchers, and there is ample evidence of their superiority for estimation of this kind of models (see Gelman et al., 2004)1.An advantage of estimating hierarchical Bayes models with MCMC methods is that it yields estimates of all model parameters, including estimates of model parameters associated with specific respondents.
Several factors favor our approach. First, the Bayesian hierarchy captures systematic (as well as random) sources of heterogeneity in multiple-store shopping, so we can assess the predictive contribution of three different types of variables: purchase histories, demographics, and geographic variables. Also, because the Gibbs Sampler allows us to sample from the posterior distribution of any function of model parameters, we can construct Bayesian prediction intervals for multiple-store shopping. Finally, our approach requires only households’ data, which most grocery retailers already gather, and multi-outlet panel data.
3.2.1. The dataset
We consider a sample of N households and we analyze the shopping trips of each household during a fixed period T (one year).
Our data set is given by D = {(xij,tij, hij);j=1,…,ni; i=1,…,N} where:
xij = (xi,j,1,….,xi,j,p)’ are the covariates corresponding to the i-th household in the j-th trip;
0 ≤ ti1 < ti2 < … < ti,ni ≤ T are the days on which the i-th household goes shopping;
hij = - log
IHHi,ti,j
withtij
,
IHHi = -
tij j , i
m
1 k
2 t , k ,
pi where:
tij
, k ,
pi is the percentage of expenditure of the i-th household in store k on the j-th shopping trip.
3.2.2. The model
Taking into account the mixed character of the dependent variable HHI, the model we consider is a Dynamic Tobit model given by:
hij =
ij i ij
ij
ij i
x β x
β
x β
2 ' 1 '
2 ' 1
y probabilit with
- 1 y probabilit with
0
(1)
where: ij ~ N
0,i1
and = (1,…, p)’ is the vector of the regression coefficients that determine the sign and the intensity of the influence of the independent covariates on the multiple-store shopping of a household.The model is a multivariate system of hierarchical Bayesian Tobit censored regressions which is estimated using the Gibbs Sampler. Every predictor variable specified in the model is found in panel data. Although retailers may not currently gather every predictor variable, they could; and retailer decisions about gathering additional variables could be informed by our evaluation of the variables’ predictive contributions.
3.3.3. Prior distribution
Given that we adopt a Bayesian approach to the problem, we need to specify a prior distribution on the parameters of the model. In our case, we have adopted the usual fully conjugate prior distributions given by:
~ Np(0,S) (2)
i ~
2
s ,n 2
Gamma n 0 ; i=1,…, N (3)
With: known constants n> 0, s0> 0 and a known symmetrical definite positive matrix S (pxp) and all the distributions (2)-(3) mutually independent.
1 Hierarchical modeling is a generalization of the regression model in which regression coefficients are themselves given a model, whose parameters are also estimated from data (Gelman, 2006).
3.3.4. Posterior Distribution
In order to calculate the posterior distribution, we use the data augmentation technique (Tanner and Wong, 1987) and we introduce the non-positive latent variables = {ij; j{1,…,ni}:
hij=0; i=1,…, N}. We also define ij = hij for j{1,…,ni}: hij>0.
Let = (, , ) the vector of parameters where = (1,…, N).
We consider the probability distribution given by:
[ | D]
N
1 i
n
1 j
ij i ij
i |β, ,x [|S]
N
1 i
0
i |n ,s
N
1 i
n
1 j
2 ij ' ij 2 i
1 i
i
exp 2 β x
0 h : ) j , i (
ij 0 ,
ij
I
β'S1β 2
exp 1
N
1 i
i , 0 i 1 0
2 n
i I
2 s
exp n (4)
where: IA denotes the indicator function of A and Rp+1 = {symmetrical definite positive matrices (p+1)x(p+1)}. The posterior distribution of (,) is the corresponding marginal distribution of (4).
This is not a standard distribution and we use MCMC methods (Rossi et al., 2005) to calculate it.
In particular, we use the Gibbs sampling algorithm employing the full conditional distributions of (4) which are described in the Appendix A. In this way, we obtain the following sample:
{(j) =
, ,..., , ;j s0,s0 L,....,s0
S 1)L
) j ( ) j ( N ) j ( 1 ) j
( λ
β (5)
where: s0 is the “burn-in” number of iterations necessary to achieve convergence, L is the number of estimated steps needed to obtain an approximate uncorrelated sample and S is the sample size. Using sample (5), it is possible to make inferences about the parameters of model (1)-(2) calculating medians and quantiles that let us to obtain point estimations and Bayesian credibility intervals of the parameters of the model.
4. RESULTS
We have taken p = 23 independent variables, namely, the constant, the 20 variables that come from adopting the indicator codification of the categorical variables listed in Table 2, the interpurchase time and the Naperian logarithm of per capita expenditure. We take n0 = 0.1, s0 =
1 and S = 100I, which constitutes a flat prior distribution of the parameters of the model2.
Gibbs sampling was run for 10,000 iterations and the convergence was achieved after s0
= 1001 iterations. We took a sample every L = 10 iterations in order to obtain an approximate uncorrelated sample. Therefore, the sample size of (5) was S = 900.
The estimations of the parameters of the model are shown in Table 4. In particular, we have calculated the posterior median and the posterior quantiles 2.5 and 97.5 calculated from sample (5) that constitutes a point estimation and the limits of the 95% Bayesian credibility interval, respectively, of the parameters of the model.
Table 4. Estimation of the parameters of the model++
Variable Quantile 2.5 Median Quantile 97.5
Constant 0.6062 0.6231 0.6396
log(Expenditure per capita) -0.0132 -0.0101 -0.0069 Interpurchase Time -0.0010 -0.0007 -0.0005
Lower Class 0.0657 0.0754 0.0851
Higher Class 0.0314 0.0375 0.0429
Household Size 1 -0.0808 -0.0607 -0.0412 Household Size 2 0.0212 0.0303 0.0395 Household Size 3 0.0679 0.0782 0.0891 Household Size 4 0.0663 0.0736 0.0807 Age < 35 -0.0479 -0.0342 -0.0194
Age > 55 0.0703 0.0778 0.0857
Employment 0.0331 0.0409 0.0476
Children < 12 -0.0254 -0.0170 -0.0091 AC Nielsen Area II -0.0725 -0.0583 -0.0457 AC Nielsen Area III -0.2030 -0.1889 -0.1750 AC Nielsen Area IV -0.0420 -0.0216 -0.0053 AC Nielsen Area V 0.0214 0.0377 0.0493 AC Nielsen Area VI -0.0769 -0.0590 -0.0451 AC Nielsen Area VII -0.0427 -0.0212 -0.0032 AC Nielsen Area VIII 0.0261 0.0369 0.0485 Town Size < 10 -0.0470 -0.0331 -0.0188 10 < Town Size < 50 0.0642 0.0744 0.0846 50 < Town Size < 200 0.0327 0.0434 0.0565
++ All the coefficients are significant at 95%.
2 A model parameter sensitivity study reveals to have an insignificant effect on results due to sample size.
From the results shown in Table 3, it can be seen that all the independent covariates of the model have a significant influence on household multiple-store shopping, but not all of them are in the expected direction. More specifically:
1) Given that the per capita expenditure coefficient is significantly negative, it follows that the higher the aggregate purchase volume, the lower the dynamic variation in the store set. So, hypothesis H1 must be accepted.
2) The coefficient of interpurchase time is negative. Therefore, the lower the interpurchase time, the higher the variation in the store set over time. So, hypothesis H2 is accepted and the interpurchase time is directly related to the variation in the store set.
3) The coefficients of the lower and higher categories of the social class variable are positive. This reveals that social class has a non-monotonic effect on the variation in the store set, the middle class households having a lower variation in their store set.
Thus, households with higher socioeconomic status show a higher multiple-store shopping than middle ones; in consequence, hypothesis H3 can not be accepted.
4) The signs of the coefficients of the household size variables reveal a non-monotonic relation with multiple-store shopping behavior, the smaller and the larger households being those with less variation in the store set. In particular, households of size 3 and 4 are the ones which tend to have the greatest variation. Therefore, hypothesis H4 is rejected.
5) The age of the buyer is directly related to the variation in the store set. Elder people tend to have the greatest dynamic variation and young people the least.
Consequently, hypothesis H5 is accepted. As an improvement to this study and in order to capture details that shopper age can not explain, we propose an in-depth study of the family life cycle.
6) The employment commitments of the shoppers have a significant influence on the variation in their store set. However, the relationship operates in the opposite direction to what was expected. The shoppers that work tend to have the greatest dynamic variation, so hypothesis H6 is rejected.
7) If there are small children in the home, the variation in the household store set seems to be lower. So, hypothesis H7 can be accepted.
8) The geographical area where the household shops influences the degree of variation.
Specifically, households in the south (Area III) show the lowest variation over time in their store set. The situation is the opposite in the northwest (Area V) and the metropolitan area of Madrid. Thus, hypothesis H8 is accepted.
9) The effect of the town size is non-linear. Households in medium-size towns (between 10,000 and 200,000 inhabitants) tend to have greater dynamic variation than those in smaller and bigger towns. Therefore, hypothesis H9 must be rejected.
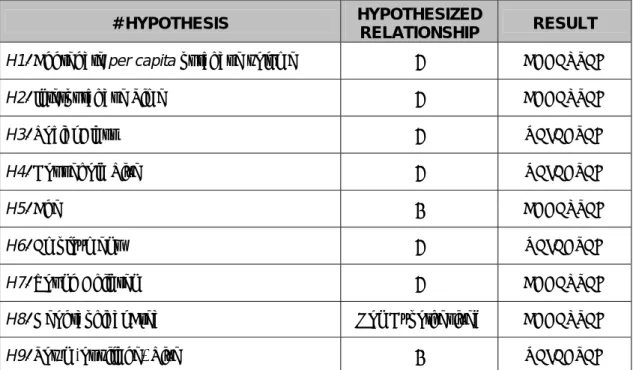
In Table 5, the expected sign of the 9 hypothesized relationships can be seen.
Table 5. Expected signs and resultant effects +
# HYPOTHESIS HYPOTHESIZED
RELATIONSHIP RESULT H1. Aggregate per capita purchase volume ACCEPTED
H2. Interpurchase Time ACCEPTED
H3. Social Class REJECTED
H4. Household Size REJECTED
H5. Age ACCEPTED
H6. Employment REJECTED
H7. Young Children ACCEPTED
H8. Geographical Area Non Hypothesized ACCEPTED
H9. Town (or village) Size REJECTED
+ : Non-decreasing monotone effect; : Non-increasing monotone effect
5. CONCLUSIONS, MANAGERIAL GUIDELINES AND FURTHER RESEARCH
In this research, we have carried out a dynamic analysis of multiple-store shopping using a panel of Spanish households over a one-year period. The focus of our paper is on understanding multiple dimensions of household store choice behavior. The results confirm that multiple-store shopping is widespread for FMCG and that several variables (interpurchase time, social class, age, whether the shopper has young children and geographical area) have the expected influence on it.
Our research contributes to the consumer behavior literature since, to our knowledge, no previous work has examined the drivers of multiple-store shopping in Spain in the context of a store set used for the purchase of FMCG. The results reported here are consistent with those obtained in previous studies in a brand choice context and using store scanner databases, in which it has been shown that there is a considerable variation across retailers, across product categories, and within a product category for a given retailer.
Moreover, those households living on the south coast and east coast of the peninsula show a less varied purchasing environment. This result could lead to an interesting, in-depth study on the heterogeneity that this variable could reflect, regarding both the supply side and the characteristics of the households that make up the demand side in the various geographic zones.
In short, belonging to a higher social class, having a smaller household size, a greater volume in the shopping basket and a lower interpurchase time are characteristics of households whose store set varies less over the period analyzed.
Due to the high level of disaggregation of our data, the variables related to household and town size and social class have been found to show a non-linear effect. Smaller towns offer fewer shopping alternatives, but larger towns involve significantly higher travel costs for shoppers. So, managers will have more possibilities to influence household multiple-store shopping behavior in medium size towns.
Work commitments and volume of the shopping basket have shown the opposite relation to what was expected. This could be reflecting aspects related to the economic power of the households that still have to be explored.
Besides, we can affirm that managers taking several decisions, such as the location of a new store and the implementation of retention strategies mixed with variety and multi-format strategies, must consider the demographic and geographical characteristics of their customers.
They have to make an effort to study the profiles of households by geographical area before taking their final decisions. For this purpose, advanced Geographical Information Systems may be useful.
Among the limitations of this study is the fact that we have used a secondary data source. It would be more adequate to mix primary and secondary data in order to better capture the underlying factors of multiple-store shopping.
The Tobit model we have used assumes that the effect of the independent variables is homogeneous for all the households in the sample. This is an aspect that needs to be addressed in the future. Bayesian hierarchical modeling, like a hierarchical Tobit model, may be a useful tool for performing analyses like these. Moreover, more general and flexible models such as the Separate Decision model described in Lancaster (2004) could be used.
Another limitation of this study comes from the limited external validity of the analysis reported here. Hence, it is necessary to replicate the study by using different databases.
We consider that this research may be broadened and the managerial implications enriched through the analysis of the synergies between the defensive strategies, variety strategies and multi-format strategies of retail companies. So, it would be interesting to carry out an in-depth study using a mixed supply and demand database.
6. APPENDIX A. Full conditional distributions of (4)
In this appendix, we describe the full conditional distributions necessary to implement the Gibbs sampling algorithm. They are standard and its deduction is omitted.
1) | D, rest of parameters
This distribution is Np(m,S) with m =
N
1 i
i ' i i 1 N 1
1 i
i ' i
iXX S X λ and S =
1 N 1
1 i
i ' i i
XX S where Xi =
' n , i
' 1 , i
i
...
x x
, i = 1,…, N
2) i | D, rest of parameters ~
2 s
n 2 ,
n Gamma n
ni
1 j
2 ij ' ij 0
i
x β
3) ij | D, rest of parameters where (i,j) : hij = 0 ~
ij i1
' ,
Nβ x truncated in (-,0).
7. REFERENCES
Andrews, R. L. and Currim, I. S. (2002). “Identifying Segments with Identical Choice Behaviors across Product Categories: An Intercategory Logit Mixture Model”, International Journal of Research in Marketing, 19, 65–79.
Berne, C., Mugica, J. M. and Yagüe, M. J. (2001). “The Effect of Variety-Seeking on Customer Retention in Services”, Journal of Retailing and Consumer Services, 8, 335–345.
Berne, C.; Mugica, J. M. and Rivera, P. (2005). “Managerial Ability to Control the Varied Behaviour of Regular Customers in Retailing: Interformat Differences”, Journal of Retailing and Consumer Services, 12, 151–164.
Chintagunta, P. K. and Gupta, S. (1994). “On Using Demographic Variables to Determine Segment Membership in Logit Mixture Models”, Journal of Marketing Research, 31 (February), 128–139.
Coleman, R. P. (1983). “The Continuing Significance of Social Class to Marketing”, Journal of Consumer Research, 10, 265–280.
Dekimpe, M.G., Steenkamp, J-B. E.M., Mellens, M. and Abeele, P.V. (1997). “Decline and Variability in Brand Loyalty”, International Journal of Research in Marketing, 14, 405–420.
Dube, L. and Maute, M. (1996). “The Antecedents of Brand Switching, Brand Loyalty and Verbal Responses To Service Failure”, Advances in Services Marketing and Management, 5, 127–
151.
East, R., Harris, P., Willson, G. and Lomax, W. (1995). “Loyalty to Supermarkets”, International Review of Retail, Distribution and Consumer Research, 5 (1), 99–109.
East, R., Harris, P., Lomax, W., Willson, G. and Perkins, D. (1997). “First-Store Loyalty to US and British Supermarkets”, Kingston Business School, Occasional Paper Series, July, 27, 1–
15.
East, R., Hammond, K., Harris, P. and Lomax, W. (2000). “First-Store Loyalty and Retention”, Journal of Marketing Management, 16 (4), 307–325.
Fox, E. J., Montgomery, A. L. and Lodish, L. (2004). “Consumer Shopping and Spending across Retail Formats”, Journal of Business, 77 (2), S25–S60.
Gelman, A., Carlin, J.B., Stern, H.S. and Rubin, D.B. (2004): Bayesian Data Analysis, Second Edition, Boca Raton, FL: Chapman & Hall/CRC.
Gelman, A. (2006): “Multilevel (Hierarchical) Modeling: What It Can and Cannot Do”, Technometrics, 48 (3), August, 432–435.
Gijsbrechts, E., Campo, K. and Nisol, P. (2008). “Beyond Promotion-Based Store Switching:
Antecedents and Patterns of Systematic Multiple-Store Shopping”, International Journal of Research in Marketing, 25 (1), March, 5–21.
Givon, M. (1984). “Variety-Seeking Through Brand Switching”, Marketing Science, 3 (1), 1–22.
González-Benito, O. (2005): “Spatial Competitive Interaction of Retail Store Formats: Modeling Proposal and Empirical Results”, Journal of Business Research, 58, 457–466.
González-Benito, O. and Santos Requejo, L. (2002). “Características del Consumidor en la Búsqueda de Perfiles Latentes de Respuesta de Mercado: Aplicación a la Selección de Establecimiento Minorista”, Revista Española de Investigación de Marketing ESIC, 6 (1), 37–
58.
Henry, P. (2002). “Systematic Variation in Purchase Orientations across Social Classes”, Journal of Consumer Marketing, 19 (5), 424–438.
Herrington, J.D. and Capella, L.M. (1995). “Shoppers Reactions to Perceived Time Pressure”, International Journal of Retail & Distribution Management, 23 (12), 13–21.
Jeuland, A. P. (1978). “Brand Preferences over Time: A Partially Deterministic Operationalization of the Notion of Variety-Seeking”. In: Research Frontiers in Marketing:
Dialogues and Directions, S. Jain (Ed.). Educators’ Conference Proceedings. (Chicago:
American Marketing Association), 43, 33–38.
Kahn, B. E. (1995). “Consumer Variety-Seeking among Goods and Services. An Integrative Review”, Journal of Retailing and Consumer Services, 2 (3), 139–148.
Kahn, B. E. and McAlister, L. (1997). Grocery Revolution: The New Focus on the Consumer, Reading, MA: Addison Wesley, Longman.
Labeaga, J.M.; Lado, N. and Martos, M. (2007). “Behavioural Loyalty towards Store Brands”, Journal of Retailing and Consumer Services, 14, 347–356.
Lancaster, T. (2004). An Introduction to Modern Bayesian Econometrics. Blackwell Publishing.
Mägi, A. W. (2003). “Share of Wallet in Retailing: The Effects of Customer Satisfaction, Loyalty Cards and Shopper Characteristics”, Journal of Retailing, 79 (2), 97–106.
Martineau, P. (1958): “Social Classes and Spending Behavior”, Journal of Marketing, 23 (2), October, 121–130.
Mason, N. (1991). “An Investigation into Grocery Shopping Behaviour in Britain”, AC Nielsen, Nielsen House, Heading-on, Oxford OX3 9RX.
McGoldrick, P. J. and Andre, E. (1997). “Consumer Misbehaviour: Promiscuity or Loyalty in Grocery Shopping”, Journal of Retailing and Consumer Services, 4 (2), 73–81.
Meulenberg, M. T. G. (1989). “Variation in Food Consumption: Some Aspects of Measurement and Empirical Findings for the Netherlands”, Tijdschrift voor Sociaal -Wetenschappelijk Onderzoek van de Landbouw, 4, 3–24.
Mihić, M. and Čulina, G. (2006). “Buying Behavior Consumption: Social Class versus Income”, Management: Journal of Contemporary Management Issues, 11 (2), 77–92.
Nickols, S. Y. and Fox, K. D. (1983): “Buying Time and Saving Time: Strategies for Managing Household Production”, Journal of Consumer Research, 10 (September), 197–208.
Park, C. W., Moorman, Ch. and Kohli, R. (1991). “A Strategic Framework for Predicting and Managing Consumer Loyalty to Need-Satisfying Alternatives”, Working Paper, University of Wisconsin.
Pessemier, E. A. (1985). “Varied Individual Behaviour: Some Theories, Measurement and Models”, Multivariate Behavioural Research, 20, 69–94.
Popkowski-Leszczyc, P. T. L. and Timmermans, H. J. P. (1997). “Store Switching Behavior”, Marketing Letters, 8 (2), 193–204.
Reader, S. (1993). “Unobserved Heterogeneity in Dynamic Discrete Choice Models”, Environment and Planning A, 25 (4), April, 495–519.
Rhee, H. and Bell, D. R. (2002). “The Inter-Store Mobility of Supermarket Shoppers”, Journal of Retailing, 78 (4), 225–237.
Rossi, P. E. and Allenby, G. M. (2003). “Bayesian Statistics and Marketing”, Marketing Science, 22 (3), 304–328.
Rossi, P. E., Allenby, G. M. and McCulloch, R. (2005). Bayesian Statistics and Marketing, Wiley Series in Probability and Statistics.
Schaninger, C. M. (1981). “Social Class versus Income Revisited: An Empirical Investigation”, Journal of Marketing Research, 18, May, pp. 192–208.
Seetharaman, P. B. and Chintagunta, P. (1998). “A Model of Inertia and Variety-Seeking with Marketing Variables”, International Journal of Research in Marketing, 15, 1–17.
Segarra, P. (2007). Influencia de la Heterogeneidad del Mercado en la Intención de Comportamiento del Consumidor: Respuestas a la Actividad Relacional en la Distribución de Gran Consumo, Tesis Doctoral, Universitat Rovira i Virgili, Junio, Barcelona.
Shimp, T. A. and Yokum, J. T. (1981). “Extensions of the Basic Social Class Model Employed in Consumer Research”, Advances in Consumer Research, 8, 702–707.
Slocum, Jr. John W. and Mathews, H. L. (1970). “Social Class and Income as Indicators of Consumer Credit Behavior”, Journal of Marketing, 34 (2), 69–74.
Soberon-Ferrer, H. and Dardis, R. (1991). “Determinants of Household Expenditures for Services”, Journal of Consumer Research, 17 (4), 385–397.
Tanner, M. A. and Wong, W. (1987). “The Calculation of Posterior Distributions by Data Augmentation”, Journal of the American Statistical Association, 82, 528–549.
Theil, H. and Finke, R. (1983). “The Consumer’s Demand for Diversity”, European Economic Review, 23, 395–400.
Van Trijp, H. C. M. (1995). “Variety Seeking in Product Choice Behaviour: Theory with Applications in the Food Domain”, Mansholt Series, 1, Wageningen, The Netherlands:
Wageningen University.
Van Trijp, H. C. M. and Steenkamp, J.-B.E.M. (1992). “Consumers’ Variety Seeking Tendency with respect to Foods: Measurement and Managerial Implications”, European Review of Agricultural Economics, 19 (2), 181–195.
Wrigley, N. and Dunn, R. (1984a). "Stochastic Panel-Data Models of Urban Shopping Behavior:
1. Purchasing at Individual Stores in a Single City", Environment and Planning A, 16, 629–
650.
Wrigley, N. and Dunn, R. (1984b). "Stochastic Panel-Data Models of Urban Shopping Behavior:
2. Multistore Purchasing Patterns and the Dirichlet Model", Environment and Planning A, 16, 759–778.
F
UNDACIÓN DE LASC
AJAS DEA
HORROS DOCUMENTOS DE TRABAJOÚltimos números publicados
159/2000 Participación privada en la construcción y explotación de carreteras de peaje Ginés de Rus, Manuel Romero y Lourdes Trujillo
160/2000 Errores y posibles soluciones en la aplicación del Value at Risk Mariano González Sánchez
161/2000 Tax neutrality on saving assets. The spahish case before and after the tax reform Cristina Ruza y de Paz-Curbera
162/2000 Private rates of return to human capital in Spain: new evidence F. Barceinas, J. Oliver-Alonso, J.L. Raymond y J.L. Roig-Sabaté 163/2000 El control interno del riesgo. Una propuesta de sistema de límites
riesgo neutral
Mariano González Sánchez
164/2001 La evolución de las políticas de gasto de las Administraciones Públicas en los años 90 Alfonso Utrilla de la Hoz y Carmen Pérez Esparrells
165/2001 Bank cost efficiency and output specification Emili Tortosa-Ausina
166/2001 Recent trends in Spanish income distribution: A robust picture of falling income inequality Josep Oliver-Alonso, Xavier Ramos y José Luis Raymond-Bara
167/2001 Efectos redistributivos y sobre el bienestar social del tratamiento de las cargas familiares en el nuevo IRPF
Nuria Badenes Plá, Julio López Laborda, Jorge Onrubia Fernández
168/2001 The Effects of Bank Debt on Financial Structure of Small and Medium Firms in some Euro- pean Countries
Mónica Melle-Hernández
169/2001 La política de cohesión de la UE ampliada: la perspectiva de España Ismael Sanz Labrador
170/2002 Riesgo de liquidez de Mercado Mariano González Sánchez
171/2002 Los costes de administración para el afiliado en los sistemas de pensiones basados en cuentas de capitalización individual: medida y comparación internacional.
José Enrique Devesa Carpio, Rosa Rodríguez Barrera, Carlos Vidal Meliá
172/2002 La encuesta continua de presupuestos familiares (1985-1996): descripción, representatividad y propuestas de metodología para la explotación de la información de los ingresos y el gasto.
Llorenc Pou, Joaquín Alegre
173/2002 Modelos paramétricos y no paramétricos en problemas de concesión de tarjetas de credito.
Rosa Puertas, María Bonilla, Ignacio Olmeda
José Vicente Blanes Cristóbal
175/2003 La Administración tributaria en España. Un análisis de la gestión a través de los ingresos y de los gastos.
Juan de Dios Jiménez Aguilera, Pedro Enrique Barrilao González 176/2003 The Falling Share of Cash Payments in Spain.
Santiago Carbó Valverde, Rafael López del Paso, David B. Humphrey Publicado en “Moneda y Crédito” nº 217, pags. 167-189.
177/2003 Effects of ATMs and Electronic Payments on Banking Costs: The Spanish Case.
Santiago Carbó Valverde, Rafael López del Paso, David B. Humphrey
178/2003 Factors explaining the interest margin in the banking sectors of the European Union.
Joaquín Maudos y Juan Fernández Guevara
179/2003 Los planes de stock options para directivos y consejeros y su valoración por el mercado de valores en España.
Mónica Melle Hernández
180/2003 Ownership and Performance in Europe and US Banking – A comparison of Commercial, Co- operative & Savings Banks.
Yener Altunbas, Santiago Carbó y Phil Molyneux
181/2003 The Euro effect on the integration of the European stock markets.
Mónica Melle Hernández
182/2004 In search of complementarity in the innovation strategy: international R&D and external knowledge acquisition.
Bruno Cassiman, Reinhilde Veugelers
183/2004 Fijación de precios en el sector público: una aplicación para el servicio municipal de sumi- nistro de agua.
Mª Ángeles García Valiñas
184/2004 Estimación de la economía sumergida es España: un modelo estructural de variables latentes.
Ángel Alañón Pardo, Miguel Gómez de Antonio
185/2004 Causas políticas y consecuencias sociales de la corrupción.
Joan Oriol Prats Cabrera
186/2004 Loan bankers’ decisions and sensitivity to the audit report using the belief revision model.
Andrés Guiral Contreras and José A. Gonzalo Angulo
187/2004 El modelo de Black, Derman y Toy en la práctica. Aplicación al mercado español.
Marta Tolentino García-Abadillo y Antonio Díaz Pérez 188/2004 Does market competition make banks perform well?.
Mónica Melle
189/2004 Efficiency differences among banks: external, technical, internal, and managerial Santiago Carbó Valverde, David B. Humphrey y Rafael López del Paso
190/2004 Una aproximación al análisis de los costes de la esquizofrenia en españa: los modelos jerár- quicos bayesianos
F. J. Vázquez-Polo, M. A. Negrín, J. M. Cavasés, E. Sánchez y grupo RIRAG 191/2004 Environmental proactivity and business performance: an empirical analysis
Javier González-Benito y Óscar González-Benito
192/2004 Economic risk to beneficiaries in notional defined contribution accounts (NDCs) Carlos Vidal-Meliá, Inmaculada Domínguez-Fabian y José Enrique Devesa-Carpio
193/2004 Sources of efficiency gains in port reform: non parametric malmquist decomposition tfp in- dex for Mexico
Antonio Estache, Beatriz Tovar de la Fé y Lourdes Trujillo 194/2004 Persistencia de resultados en los fondos de inversión españoles
Alfredo Ciriaco Fernández y Rafael Santamaría Aquilué
195/2005 El modelo de revisión de creencias como aproximación psicológica a la formación del juicio del auditor sobre la gestión continuada
Andrés Guiral Contreras y Francisco Esteso Sánchez
196/2005 La nueva financiación sanitaria en España: descentralización y prospectiva David Cantarero Prieto
197/2005 A cointegration analysis of the Long-Run supply response of Spanish agriculture to the common agricultural policy
José A. Mendez, Ricardo Mora y Carlos San Juan
198/2005 ¿Refleja la estructura temporal de los tipos de interés del mercado español preferencia por la li- quidez?
Magdalena Massot Perelló y Juan M. Nave
199/2005 Análisis de impacto de los Fondos Estructurales Europeos recibidos por una economía regional:
Un enfoque a través de Matrices de Contabilidad Social M. Carmen Lima y M. Alejandro Cardenete
200/2005 Does the development of non-cash payments affect monetary policy transmission?
Santiago Carbó Valverde y Rafael López del Paso
201/2005 Firm and time varying technical and allocative efficiency: an application for port cargo han- dling firms
Ana Rodríguez-Álvarez, Beatriz Tovar de la Fe y Lourdes Trujillo 202/2005 Contractual complexity in strategic alliances
Jeffrey J. Reuer y Africa Ariño
203/2005 Factores determinantes de la evolución del empleo en las empresas adquiridas por opa Nuria Alcalde Fradejas y Inés Pérez-Soba Aguilar
204/2005 Nonlinear Forecasting in Economics: a comparison between Comprehension Approach versus Learning Approach. An Application to Spanish Time Series
Elena Olmedo, Juan M. Valderas, Ricardo Gimeno and Lorenzo Escot
Esther Decimavilla, Carlos San Juan y Stefan Sperlich 206/2005 Interregional migration in Spain: a semiparametric analysis
Adolfo Maza y José Villaverde
207/2005 Productivity growth in European banking
Carmen Murillo-Melchor, José Manuel Pastor y Emili Tortosa-Ausina
208/2005 Explaining Bank Cost Efficiency in Europe: Environmental and Productivity Influences.
Santiago Carbó Valverde, David B. Humphrey y Rafael López del Paso
209/2005 La elasticidad de sustitución intertemporal con preferencias no separables intratemporalmente: los casos de Alemania, España y Francia.
Elena Márquez de la Cruz, Ana R. Martínez Cañete y Inés Pérez-Soba Aguilar
210/2005 Contribución de los efectos tamaño, book-to-market y momentum a la valoración de activos: el caso español.
Begoña Font-Belaire y Alfredo Juan Grau-Grau
211/2005 Permanent income, convergence and inequality among countries José M. Pastor and Lorenzo Serrano
212/2005 The Latin Model of Welfare: Do ‘Insertion Contracts’ Reduce Long-Term Dependence?
Luis Ayala and Magdalena Rodríguez
213/2005 The effect of geographic expansion on the productivity of Spanish savings banks Manuel Illueca, José M. Pastor and Emili Tortosa-Ausina
214/2005 Dynamic network interconnection under consumer switching costs Ángel Luis López Rodríguez
215/2005 La influencia del entorno socioeconómico en la realización de estudios universitarios: una apro- ximación al caso español en la década de los noventa
Marta Rahona López
216/2005 The valuation of spanish ipos: efficiency analysis Susana Álvarez Otero
217/2005 On the generation of a regular multi-input multi-output technology using parametric output dis- tance functions
Sergio Perelman and Daniel Santin
218/2005 La gobernanza de los procesos parlamentarios: la organización industrial del congreso de los diputados en España
Gonzalo Caballero Miguez
219/2005 Determinants of bank market structure: Efficiency and political economy variables Francisco González
220/2005 Agresividad de las órdenes introducidas en el mercado español: estrategias, determinantes y me- didas de performance
David Abad Díaz
Carlos Forner Rodríguez, Joaquín Marhuenda Fructuoso y Sonia Sanabria García 222/2005 Human capital accumulation and geography: empirical evidence in the European Union
Jesús López-Rodríguez, J. Andrés Faíña y Jose Lopez Rodríguez
223/2005 Auditors' Forecasting in Going Concern Decisions: Framing, Confidence and Information Pro- cessing
Waymond Rodgers and Andrés Guiral
224/2005 The effect of Structural Fund spending on the Galician region: an assessment of the 1994-1999 and 2000-2006 Galician CSFs
José Ramón Cancelo de la Torre, J. Andrés Faíña and Jesús López-Rodríguez
225/2005 The effects of ownership structure and board composition on the audit committee activity: Span- ish evidence
Carlos Fernández Méndez and Rubén Arrondo García
226/2005 Cross-country determinants of bank income smoothing by managing loan loss provisions Ana Rosa Fonseca and Francisco González
227/2005 Incumplimiento fiscal en el irpf (1993-2000): un análisis de sus factores determinantes Alejandro Estellér Moré
228/2005 Region versus Industry effects: volatility transmission Pilar Soriano Felipe and Francisco J. Climent Diranzo
229/2005 Concurrent Engineering: The Moderating Effect Of Uncertainty On New Product Development Success
Daniel Vázquez-Bustelo and Sandra Valle
230/2005 On zero lower bound traps: a framework for the analysis of monetary policy in the ‘age’ of cen- tral banks
Alfonso Palacio-Vera
231/2005 Reconciling Sustainability and Discounting in Cost Benefit Analysis: a methodological proposal M. Carmen Almansa Sáez and Javier Calatrava Requena
232/2005 Can The Excess Of Liquidity Affect The Effectiveness Of The European Monetary Policy?
Santiago Carbó Valverde and Rafael López del Paso
233/2005 Inheritance Taxes In The Eu Fiscal Systems: The Present Situation And Future Perspectives.
Miguel Angel Barberán Lahuerta
234/2006 Bank Ownership And Informativeness Of Earnings.
Víctor M. González
235/2006 Developing A Predictive Method: A Comparative Study Of The Partial Least Squares Vs Maxi- mum Likelihood Techniques.
Waymond Rodgers, Paul Pavlou and Andres Guiral.
236/2006 Using Compromise Programming for Macroeconomic Policy Making in a General Equilibrium Framework: Theory and Application to the Spanish Economy.
Francisco J. André, M. Alejandro Cardenete y Carlos Romero.